


Trading Strategies Using Technical Analysis
- Thread starter SwingKing
- Start date
- Tags trading strategies
Dear SM BHAI,
I dont believe that SBIN will fetch 2800 in this month itself. But I believe there is more than 90% posibility for the script to touch 2700 wich is a resistance if you see with fib levels in EOD and I thnik that movement is more than enough for me to sell my call options above Rs. 45. Ok.
Now the Question why it should move towards 2700 arise.
Ok let us have a look at weekly chart (attached herewith). Fib levels here shows a support of 2600 levels where the script closed today. It also shows that 3 ema has not crossed down the 45em (which is counted as a medium term support) and here it also match with the 2600 supports shown by the fib levels. Again if you have a look at the candlesticks it shows three deep weekly corrections for the script in which the third is of this week and weaker than other two. Moreover you can notice that, today the script have traded above yesterdays trading level which was not the case in the past two corrections. Finaly, after the last week correction the script tried to go up for three continuious weeks.
You can also see that even after the NIFTY correcting around 3 % Bank Nifty corrected only 1.19% and SBIN did not correct even 1 % today.
So If you try to add all the above factors and have look to this script cant you find something gracefull about its performance towards 2700 in next week.
Or am I wrong, I expect you, Raunak Sir or both of you may please correct me with your views.
The Chart

Regards,
Gangadharan.
I have a novice query, like going through daily chart from last mid October onwards SBI seems to be in downtrend, whenever this stock try to gain some momentum, it retraces back by more than 100%...this whole week this stock was beaten. So today might be trying to gain some base around 2600. I am not able to visualize any strength , might be missing some link, looking for some inputs from you, Raunak sir & other seniors.
regards
Attachments
-
 15.7 KB Views: 131
Can u explain IN DETAIL and WITH CHART as to why u think SBIN will move to 2800 in Jan itself.
Why I ask is that I placed order FEB 2800CE at 51 BUT never came and hit 58.55 last.
Why I ask is that I placed order FEB 2800CE at 51 BUT never came and hit 58.55 last.
Last edited:
Was shocked yest to learn you closed your puts at cost given what was happening. Anyways enough happening to throw people off.
First of all i must thank you for helping me right frm the beginning, you helped me in choosing trading laptop and right broking company also...
")
I found SH's 315 and intraday theory pretty interesting to follow...what are your views on it?
And I am also looking to open an account with indiabulls just for the good real time charting facility.
Please suggest me is it wise to go with indiabulls for charting facility or should i go with ichats.com or any other real time chart provider.
yOur msg inbox is full thats why asking here.
Thanks a lot
Hi Gang123
Some unusual way of thoughts for a general analysis of the chart.
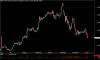
State bank of India. What to look at on Monday 10 Jan 2011 and what could happen the days after.
Around 2570 is a pivot line, which was tested today and not broken. Last time it was tested in August 2010.
The market today went through a down channels resistance line, which was around 2620 and this channel was started on the 3 of January 2011.
Then the market made a double top at around 2640. After that, market started to build a new, short time down trend line which even became faster at around 2623 and was supported at around 2590.
Zooming out this little detail, market shows a clear triangle, which occurs before any breakout up or down.
If it breaks down through the 2590 level, next support would be the down trends channel resistance line around 2560, which is at the same time the next double bottom. If this double bottom is taken, the way is free down to around 2500*, which is the next pivot point line.
If the market want to go up, it has to break the stronger down resistance line around 2620. If it breaks this, the next resistance is again at 2640/50 and then the way up to 2700 would be more or less free.
The share made jumps from 300 until 700 points in 30 days in the last few months.
Market is in a down trend. It is very possible to see the share around 2560, as it opened in January around 2850.
Dan
Some unusual way of thoughts for a general analysis of the chart.
State bank of India. What to look at on Monday 10 Jan 2011 and what could happen the days after.
Around 2570 is a pivot line, which was tested today and not broken. Last time it was tested in August 2010.
The market today went through a down channels resistance line, which was around 2620 and this channel was started on the 3 of January 2011.
Then the market made a double top at around 2640. After that, market started to build a new, short time down trend line which even became faster at around 2623 and was supported at around 2590.
Zooming out this little detail, market shows a clear triangle, which occurs before any breakout up or down.
If it breaks down through the 2590 level, next support would be the down trends channel resistance line around 2560, which is at the same time the next double bottom. If this double bottom is taken, the way is free down to around 2500*, which is the next pivot point line.
If the market want to go up, it has to break the stronger down resistance line around 2620. If it breaks this, the next resistance is again at 2640/50 and then the way up to 2700 would be more or less free.
The share made jumps from 300 until 700 points in 30 days in the last few months.
Market is in a down trend. It is very possible to see the share around 2560, as it opened in January around 2850.
Dan
Last edited:
Hi...!! Aloyraj...
First of all i must thank you for helping me right frm the beginning, you helped me in choosing trading laptop and right broking company also...
I found SH's 315 and intraday theory pretty interesting to follow...what are your views on it?
And I am also looking to open an account with indiabulls just for the good real time charting facility.
Please suggest me is it wise to go with indiabulls for charting facility or should i go with ichats.com or any other real time chart provider.
yOur msg inbox is full thats why asking here.
Thanks a lot
Yes Indiabulls platform has the least overhead cost.Several good indicators to choose from.It is good to start with,and the quotes are the quickest so it is a fail safe options for real time quotes.
But note it does not have End of day charts unlike say Sharekhan traderTiger or Amibroker with realtime feed. This is another reason to go for Amibroker in the future simple things like retracements ,like Raunak has mentioned, is not possible from Indiabulls's platform. So once we refine your system from Indiabulls you can try Amibroker later on.A trader to start will need to mature stepwise.
Well it depends on your needs if you are trading from your home then Indiabulls is good ,from office icharts will do.
Note : icharts EOD charts are free it is the realtime charts that are charged but realtime charts are freely available from Indiabulls. Initially a trader needs to keep costs lower so as to prevent overtrading and margin trades and disproportionately high prepaid brokerage.
The 315 system is simple and well defined easily adaptable for small accounts.
Word on Markets - Sanity in Insanity
Perhaps you all will think I am searching Sanity in Insanity. But, the fact is that I am still Bullish in the markets. Crack are appearing but it is not necessary for the cracks to turn into something meaningful. My positions currently are Swing short in January series, Positional Long in February series and some positions in the Portfolio. As far as the current move is concerned, I feel we may have some more distance to travel on the short side. Anyhow the way I am seeing the markets, I am looking for another opportunity for going Swing Long in the Nifty and BNifty. Long term targets for Nifty remain at 6800 by August 2011.
The kind of uncertainties in the market currently are blown out of proportion. Hence, given what has happened today and what will happen next week, we will get good buying opportunity in stocks to enter. Structurally we remain positive and in better shape than what we were back in May 2010 when last correction happened.
Keep stops tight and be flexible.
Tc
Hi Raunak and Dan and Ganga,
At the end of day, I had 2 questions:
1) Till where?? - "Buying will not help. Lack of selling will." - Bang on Sir. Enlightened. I am cautious to play trend, but it's better to know.
2) SBIN - SBIN could be anyway from here. But, I was confused. So stayed out. Now, on Monday, I'll be making a far more informed decision. Thanks to you and Ganga.
Similar threads
-

-
Trading the S/R Flip - Strategies around this widely used concept
- Started by ASB
- Replies: 4
-
I am tradingview paid user and want to use their strategies for algo trading
- Started by curiousv
- Replies: 9
-

-