


Hi,
I am the co-founder and designer of GoCharting - the first Indian web-based technical analysis software built by two traders for the traders. We are arguably one of the most advanced charting and trading platform in the market focused on Indian equity market. We cover the entire gamut of Indian stock markets (cash for now). It is a humble effort by two traders cum open source programmers to give something back to the community. We would like to create an engaged group of users in the trading community to provide feedback, request additional features and in general, help us help you
URL: https://gocharting.com
Why GoCharting?
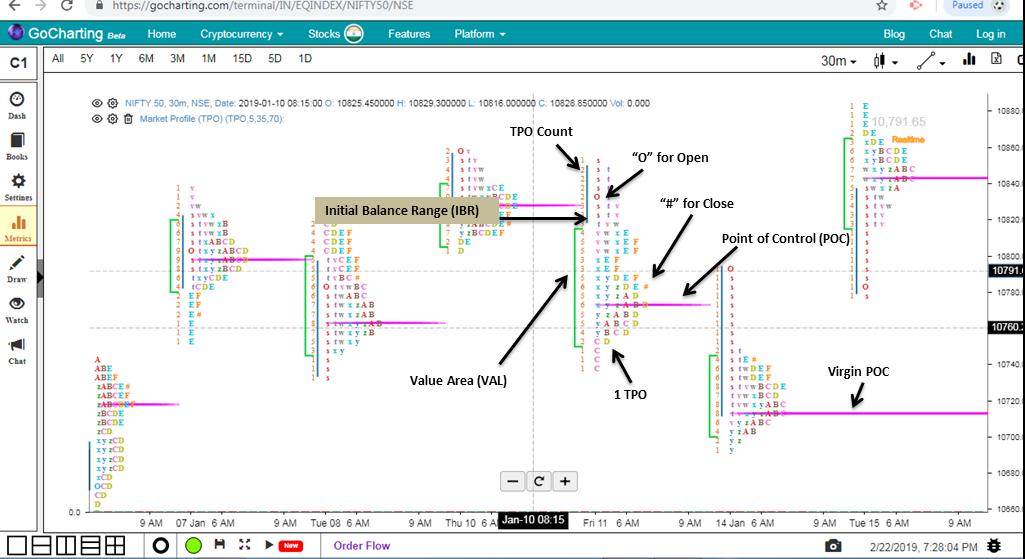
Firstly, we are the only charting platform in the world today that has successfully created professional Market Profile Charts (TPO) on the “web”. These charts combined with Volume Profile charts form the basis of Orderflow analysis in GoCharting and are the perfect tools to surf the volatility in the markets. Gone are the days when you paid hefty fees to desktop (.exe) applications of the 90’s to trade on orderflow. We offer you world-class orderflow charts on the web and we are here to stay.
See the Setup of of TPO and Volume Profile in GoCharting below:
Secondly, we are a unique advanced charting platform that has made an attempt to bring the crux of technical analysis (charting, signal detection, Indicators, Drawing) and fundamental analysis (Valuations, DCF, Risk and Reward) under the same roof in one terminal User Interface.
Lets deep dive into the details. APIs released on the Indian Stock Market segment so far:
Technical Analysis:

Multiple Plots:

Marvelous Dark

Choice of Technical Indicators:

Fundamental Analysis:
1. Proprietary Stock Valuation and Rating using our own back-tested scoring model using key fundamental signals such as Pitroski Number, Sloan Ratio, Graham Number etc.
2. Risk Scored models built for future forecasting
3. 160+ fundamental indicators (Revenue, Profit, EPS, P/E - You name it and we got it covered). All fundamental indicators are available on a scale of Quarterly, Annual and Trailing Twelve Months (TTM) timeline mode.
4. 200+ macroeconomic indicators from Quandl (Crude Oil, Gold, Rubber, GDP, Employement etc.)
5. We are the only charting platform that allows users to plot analyst estimates directly on the chart (Nirmal Bang, Motilal Oswal, ICICI Securities etc)
6. Plot dividends, splits, bonus and rights on the chart
7. Live news feed (very similar to the old Google Finance UI - we loved the old google finance)
Analyst Estimates

Fundamental Indicators

If you like what you see, please provide your feedback here or go directly to the website and chat with us.
We are keeping this discussion open here. You can ask your queries and request features on this thread. This is the official GoCharting Thread.
We look forward to having you in our platform
Regards
I am the co-founder and designer of GoCharting - the first Indian web-based technical analysis software built by two traders for the traders. We are arguably one of the most advanced charting and trading platform in the market focused on Indian equity market. We cover the entire gamut of Indian stock markets (cash for now). It is a humble effort by two traders cum open source programmers to give something back to the community. We would like to create an engaged group of users in the trading community to provide feedback, request additional features and in general, help us help you
URL: https://gocharting.com
Why GoCharting?
Firstly, we are the only charting platform in the world today that has successfully created professional Market Profile Charts (TPO) on the “web”. These charts combined with Volume Profile charts form the basis of Orderflow analysis in GoCharting and are the perfect tools to surf the volatility in the markets. Gone are the days when you paid hefty fees to desktop (.exe) applications of the 90’s to trade on orderflow. We offer you world-class orderflow charts on the web and we are here to stay.
See the Setup of of TPO and Volume Profile in GoCharting below:
Secondly, we are a unique advanced charting platform that has made an attempt to bring the crux of technical analysis (charting, signal detection, Indicators, Drawing) and fundamental analysis (Valuations, DCF, Risk and Reward) under the same roof in one terminal User Interface.
Lets deep dive into the details. APIs released on the Indian Stock Market segment so far:
Technical Analysis:
- Real-time and EOD charting on the browser. No more maintenance of archaic desktop applications, servers or data feed worries - just open your browser and you are ready to go.
- No annoying ads - premium service quality
- Tick-level data
- All NSE stocks/indices (Cash for now, will add FNO if demand exist)
- Customizable HTML5 charting
- 120 + technical indicators. (MACD, SuperTrend, EMA, SMA - you name it and we got it covered for you). No cap on how many indicators you would like to add to your chart
- For pro-traders and programmers, we have also built our own scripting language G-SCRIPT to help you create your own technical indicators, strategies and signals.
- Advanced charts such as Renko, Kagi, Heikin Ashi, Point and Figure
- Drawing tools (Fibonacci, Gann, Trendline etc.)
- Auto Candlestick pattern recognition (Doji, Three Black Crows etc.)
- Plot up to 4 charts at a time
- EOD and 5 IEOD intervals. EOD data adjusted for corporate events such as splits and bonus
- Social sharing
- Save your study on the cloud (unlimited charts)
- Fullscreen mode
- We come in a beautiful black theme too
- Advanced Watchlist and Portfolio Builder
- Download OHLC data directly on your computer
Multiple Plots:
Marvelous Dark
Choice of Technical Indicators:
Fundamental Analysis:
1. Proprietary Stock Valuation and Rating using our own back-tested scoring model using key fundamental signals such as Pitroski Number, Sloan Ratio, Graham Number etc.
2. Risk Scored models built for future forecasting
3. 160+ fundamental indicators (Revenue, Profit, EPS, P/E - You name it and we got it covered). All fundamental indicators are available on a scale of Quarterly, Annual and Trailing Twelve Months (TTM) timeline mode.
4. 200+ macroeconomic indicators from Quandl (Crude Oil, Gold, Rubber, GDP, Employement etc.)
5. We are the only charting platform that allows users to plot analyst estimates directly on the chart (Nirmal Bang, Motilal Oswal, ICICI Securities etc)
6. Plot dividends, splits, bonus and rights on the chart
7. Live news feed (very similar to the old Google Finance UI - we loved the old google finance)
Analyst Estimates
Fundamental Indicators
If you like what you see, please provide your feedback here or go directly to the website and chat with us.
We are keeping this discussion open here. You can ask your queries and request features on this thread. This is the official GoCharting Thread.
We look forward to having you in our platform
Regards
 ) has now been made available