


Nifty spot analysis BY Santhosh2010
- Thread starter santhosh2010
- Start date
- Status
- Not open for further replies.
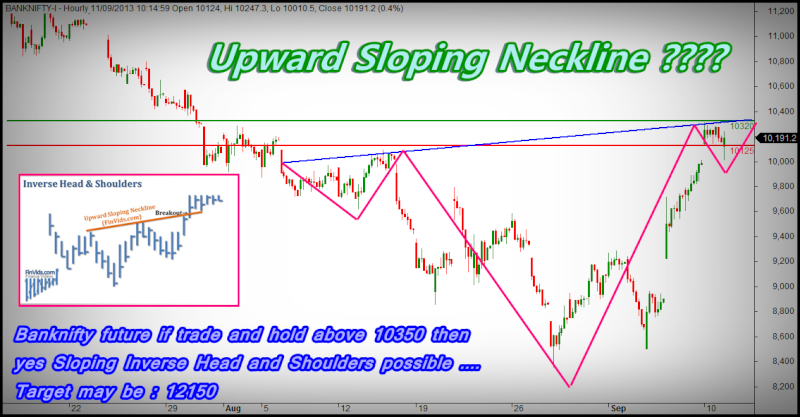
Banknifty Bullish flag pattern ???
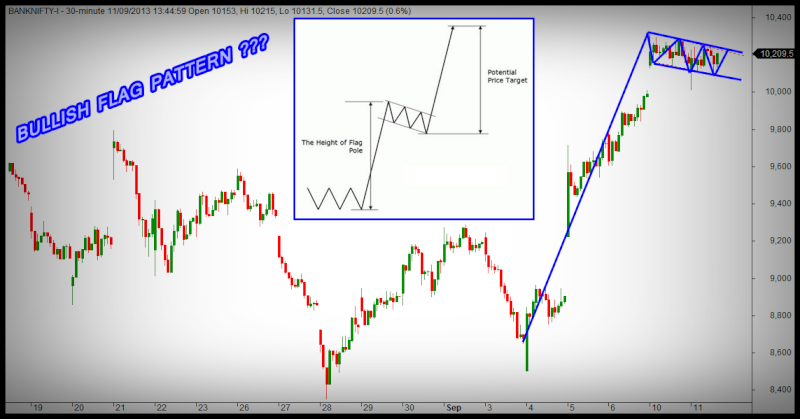
Bullish Flag is a short term bullish continuation pattern that occurs during an uptrend, indicating a pause / small consolidation before continuing the uptrend.
This pattern normally appears following a sharp price increase on high volume.
The Formation of Bullish Flag
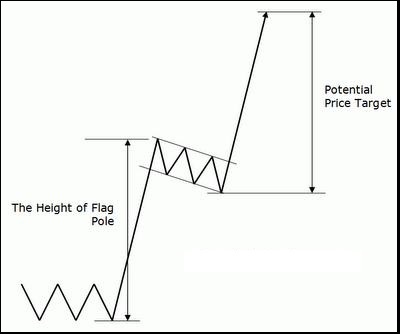
Bullish Flag Pattern is usually preceded by a very steep (almost vertical) increase in price on heavy volume. This steep price increase makes the "Flagpole" of the pattern.
The sharp rise in price may occur due to positive market sentiments toward favorable events / developments, such as positive earnings surprises, new product launch, etc.
After the sharp increase, the price movement is then contained within two parallel lines, forming a small rectangle "Flag" shape, on decreasing volume.
The rectangle flag is often slightly sloping downward, although it could be horizontal as well.
This flag represents a brief pause / consolidation in the midst of an uptrend before resuming its upward movement.
Consolidation happens when prices tend to bounce between an upper and lower price limit.
This may occur after strong price movement due to market excitement over certain events / developments.
When the excitement is beginning to subside, fewer buyers are willing to purchase at the high price (resistance), but at the same time sellers are also unwilling to sell below a lower limit (support).
The completion of the pattern occurs when prices break out to the upside through the resistance level (i.e. upper parallel line) of the Flag with a spike in volume. This would mark the resumption of the original uptrend.
The Psychology Behind Bullish Flag Pattern
A Bullish Flag pattern takes place because prices seldom move higher in a straight line for an extended period. During a sharp price movement, prices will typically take brief pause periods to "catch their breath" before continuing their move.
During the 1st stage of the Bullish Flag pattern (Flagpole part), as a result of positive market reactions toward some favorable events (e.g. positive earnings surprises, upward guidance, new product launch, etc.), prices keep on soaring sharply as new buyers, who were caught-up in the euphoria at that moment, are willing to buy at even higher prices.
As the prices rises, some early buyers who have bought the stock at lower levels would begin to sell to take profits. At this point, the 2nd stage of the Bullish Flag pattern begins (i.e. the Flag part).
At first, most of the stocks sold by the early buyers are easily absorbed, since the news and market sentiments are still very positive. Nevertheless, as time passes, buying pressures abated and fewer buyers are willing to purchase at the current, high price. Consequently, the prices begin to decrease gradually, but the decrease is slow and volume is diminishing, as the bullish sentiment is actually still very strong.
After some time, just as it starts to look as if a real decline is underway, a new positive development comes out. As a result, the price begins to move higher and break out through the upper line of the Flag with a surge in volume, as new buyers now have overwhelmed those taking profits.
In the following days, there might be more positive news and/or "buy" recommendations coming out, leading the prices to lead to escalate even higher.
Thanks to :- istockanalyst
Bullish Flag is a short term bullish continuation pattern that occurs during an uptrend, indicating a pause / small consolidation before continuing the uptrend.
This pattern normally appears following a sharp price increase on high volume.
The Formation of Bullish Flag
Bullish Flag Pattern is usually preceded by a very steep (almost vertical) increase in price on heavy volume. This steep price increase makes the "Flagpole" of the pattern.
The sharp rise in price may occur due to positive market sentiments toward favorable events / developments, such as positive earnings surprises, new product launch, etc.
After the sharp increase, the price movement is then contained within two parallel lines, forming a small rectangle "Flag" shape, on decreasing volume.
The rectangle flag is often slightly sloping downward, although it could be horizontal as well.
This flag represents a brief pause / consolidation in the midst of an uptrend before resuming its upward movement.
Consolidation happens when prices tend to bounce between an upper and lower price limit.
This may occur after strong price movement due to market excitement over certain events / developments.
When the excitement is beginning to subside, fewer buyers are willing to purchase at the high price (resistance), but at the same time sellers are also unwilling to sell below a lower limit (support).
The completion of the pattern occurs when prices break out to the upside through the resistance level (i.e. upper parallel line) of the Flag with a spike in volume. This would mark the resumption of the original uptrend.
The Psychology Behind Bullish Flag Pattern
A Bullish Flag pattern takes place because prices seldom move higher in a straight line for an extended period. During a sharp price movement, prices will typically take brief pause periods to "catch their breath" before continuing their move.
During the 1st stage of the Bullish Flag pattern (Flagpole part), as a result of positive market reactions toward some favorable events (e.g. positive earnings surprises, upward guidance, new product launch, etc.), prices keep on soaring sharply as new buyers, who were caught-up in the euphoria at that moment, are willing to buy at even higher prices.
As the prices rises, some early buyers who have bought the stock at lower levels would begin to sell to take profits. At this point, the 2nd stage of the Bullish Flag pattern begins (i.e. the Flag part).
At first, most of the stocks sold by the early buyers are easily absorbed, since the news and market sentiments are still very positive. Nevertheless, as time passes, buying pressures abated and fewer buyers are willing to purchase at the current, high price. Consequently, the prices begin to decrease gradually, but the decrease is slow and volume is diminishing, as the bullish sentiment is actually still very strong.
After some time, just as it starts to look as if a real decline is underway, a new positive development comes out. As a result, the price begins to move higher and break out through the upper line of the Flag with a surge in volume, as new buyers now have overwhelmed those taking profits.
In the following days, there might be more positive news and/or "buy" recommendations coming out, leading the prices to lead to escalate even higher.
Thanks to :- istockanalyst


Nifty spot analysis 12/sep/2013 [vimalraj]
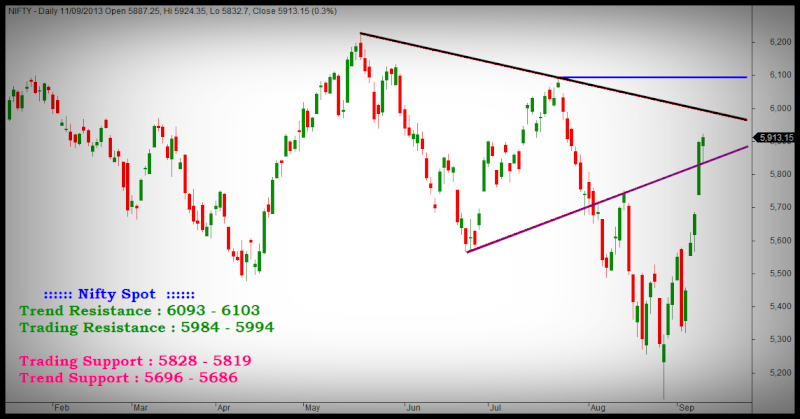
NIFTY SPOT POSITIONAL ANALYSIS
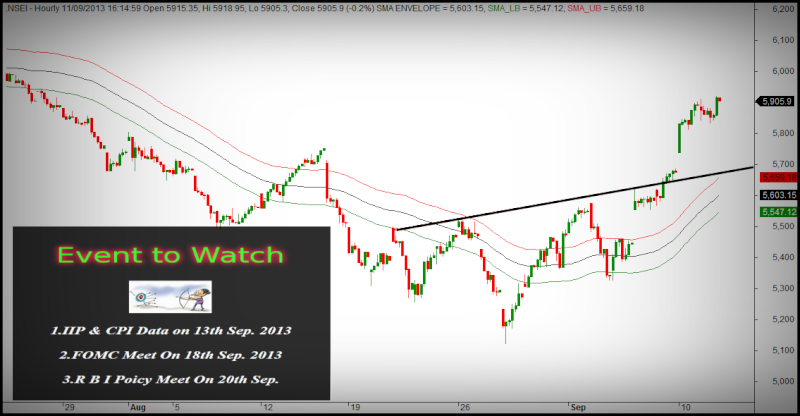
IIP NUMBERS TODAY SO SOME HIGH VOLATILE EXPECTS TODAY'S MARKET.BE CAUTION AT HIGHER LEVEL
Nifty Spot if trade below our Trading support then
positional short sellers can add some fresh shorts possible....
We hold positions with proper Hedge.... so hold the all open position...
if any fresh entry i will update in Market hours...
~~~~~~~~~~~~~~~~~~~~~~~~~~~~~~~~~~~~~~~~~~
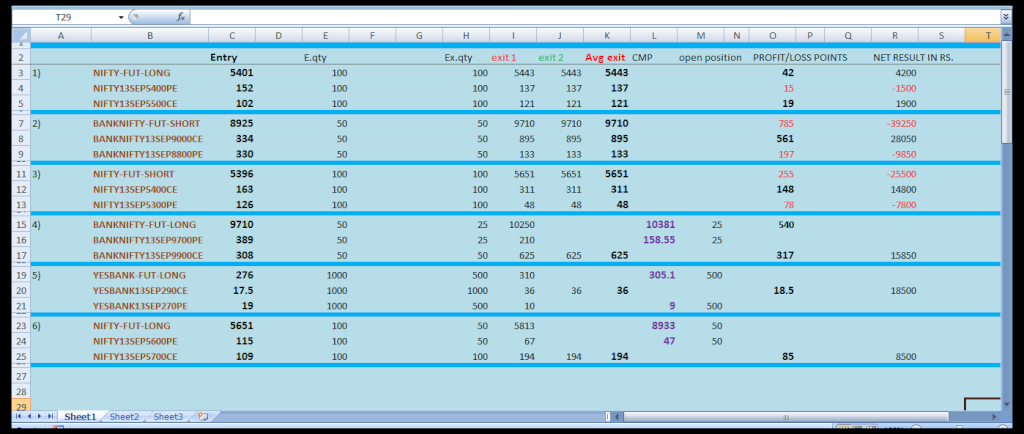
Open position update :-
Nifty future long 1 lot(5651) - Cmp (5933) = + 282 points
Nifty 5600 pe long 1 lot (115.00) - Cmp (47.00) = - 67 points
Yesbank future long 1 lot (276.00) - Cmp (305.10) = + 29.10 points
Yesbank 270 pe long 1 lot (19.00) - Cmp (9.00) = - 10.00 points
BankNifty future long 1 lot (9710) - Cmp (10381) = + 671 points
BankNifty 9700 pe long 1 lot: (389.00) - Cmp (158.85) = - 230.15 points
~~~~~~~~~~~~~~~~~~~~~~~~~~~~~~~~~~~~~~~~~~
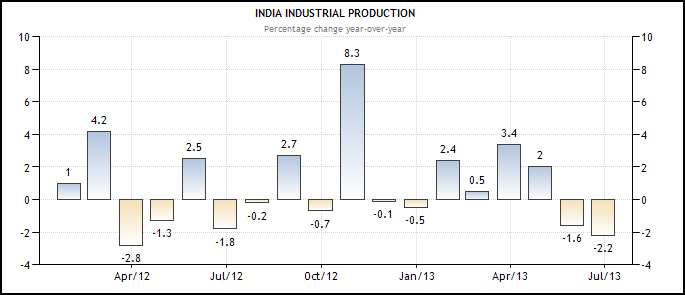
What is Index of Industrial Production (IIP)
Index of Industrial production is released monthly index which details out the growth of various sectors in an economy includes with three major sectors viz. Mining & Quarrying, Manufacturing & Electricity of State economy
IIP data is releases made by the Central Statistical Organisation of the Ministry of Statistics and Programme Implementation with the current series of all-India IIP (base 1993-94) was released in May 1998, using the data supplied by the 15 source agencies. It covers the Mining, Manufacturing and Electricity sectors with weights of 10.47%, 79.36% and 10.17% respectively.
Index of Industrial Production (IIP) is an abstract number, the magnitude of which represents the status of production in the industrial sector for a given period of time as compared to a reference period of time.
By the IIP data, we test out performance of industrial, its performance of industrial which affects to stock market.
A very original aspect of equity investing understands the company and sector in which you invest. There are a number of sectors, and equity investors require some particular knowledge to make knowledgeable investment decisions. One of those sectors is Index of Industrial production data for traders and investors
For Investors, through this statement, investors can choose top quality item from sectors, and try to know about your item of portfolio.
For Traders, on the date of declare of index of industrial data may get volatility. Volatility is crying for most of 85% traders as per our prediction.
Formula:
The index is a simple weighted arithmetic mean of production relatives calculated by using Laspeyre’s formula:
I = S(Wi Ri)/SWi
Where I is the Index, Ri is the production relative of the ith item for the month in question and Wi is the weight allotted to it.
NIFTY SPOT POSITIONAL ANALYSIS
IIP NUMBERS TODAY SO SOME HIGH VOLATILE EXPECTS TODAY'S MARKET.BE CAUTION AT HIGHER LEVEL
Nifty Spot if trade below our Trading support then
positional short sellers can add some fresh shorts possible....
We hold positions with proper Hedge.... so hold the all open position...
if any fresh entry i will update in Market hours...
~~~~~~~~~~~~~~~~~~~~~~~~~~~~~~~~~~~~~~~~~~
Open position update :-
Nifty future long 1 lot(5651) - Cmp (5933) = + 282 points
Nifty 5600 pe long 1 lot (115.00) - Cmp (47.00) = - 67 points
Yesbank future long 1 lot (276.00) - Cmp (305.10) = + 29.10 points
Yesbank 270 pe long 1 lot (19.00) - Cmp (9.00) = - 10.00 points
BankNifty future long 1 lot (9710) - Cmp (10381) = + 671 points
BankNifty 9700 pe long 1 lot: (389.00) - Cmp (158.85) = - 230.15 points
~~~~~~~~~~~~~~~~~~~~~~~~~~~~~~~~~~~~~~~~~~
What is Index of Industrial Production (IIP)
Index of Industrial production is released monthly index which details out the growth of various sectors in an economy includes with three major sectors viz. Mining & Quarrying, Manufacturing & Electricity of State economy
IIP data is releases made by the Central Statistical Organisation of the Ministry of Statistics and Programme Implementation with the current series of all-India IIP (base 1993-94) was released in May 1998, using the data supplied by the 15 source agencies. It covers the Mining, Manufacturing and Electricity sectors with weights of 10.47%, 79.36% and 10.17% respectively.
Index of Industrial Production (IIP) is an abstract number, the magnitude of which represents the status of production in the industrial sector for a given period of time as compared to a reference period of time.
By the IIP data, we test out performance of industrial, its performance of industrial which affects to stock market.
A very original aspect of equity investing understands the company and sector in which you invest. There are a number of sectors, and equity investors require some particular knowledge to make knowledgeable investment decisions. One of those sectors is Index of Industrial production data for traders and investors
For Investors, through this statement, investors can choose top quality item from sectors, and try to know about your item of portfolio.
For Traders, on the date of declare of index of industrial data may get volatility. Volatility is crying for most of 85% traders as per our prediction.
Formula:
The index is a simple weighted arithmetic mean of production relatives calculated by using Laspeyre’s formula:
I = S(Wi Ri)/SWi
Where I is the Index, Ri is the production relative of the ith item for the month in question and Wi is the weight allotted to it.
IDBI ~ Advanced trading strategy
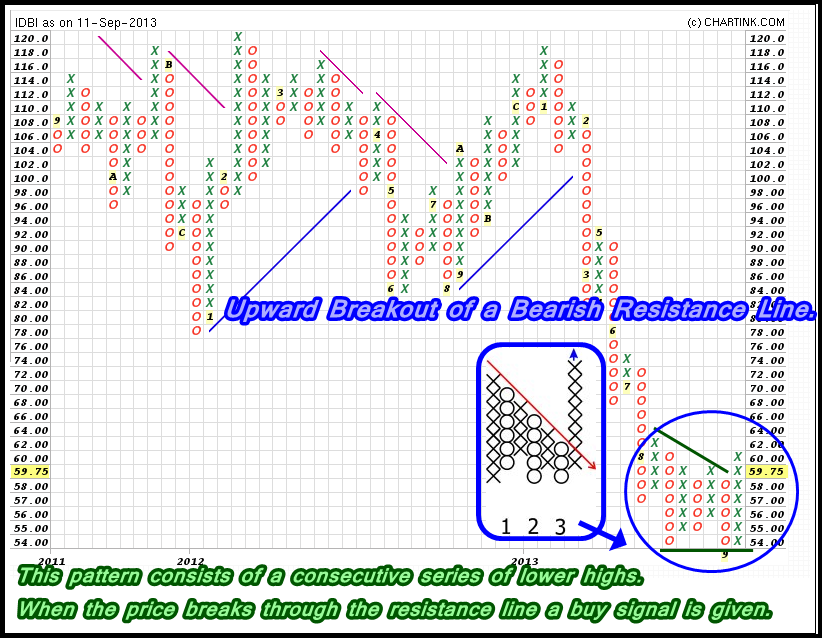
Buy 2 Lots IDBI future +
Buy 2 Lots IDBI 60 Put Option +
Buy 2 Lots IDBI 65 Call Option..
i will update my entry price after market hours
Hold this three open positions...just follow the updates...
Note : One who ready to take risk Rs.32,000 they only try...safe and small traders can try only Eq delivery trade.
- Status
- Not open for further replies.
Similar threads
-
 NIFTY/ BANK NIFTY Option Trade Tool (Buy/ Sell) based on Futures / Spot Prices
- Started by allex418
- Replies: 7
-
21500 points in banknifty spot in 13 months, will this survive post charges and slippage
- Started by Utkarsh Gupta007
- Replies: 1
-

-
-