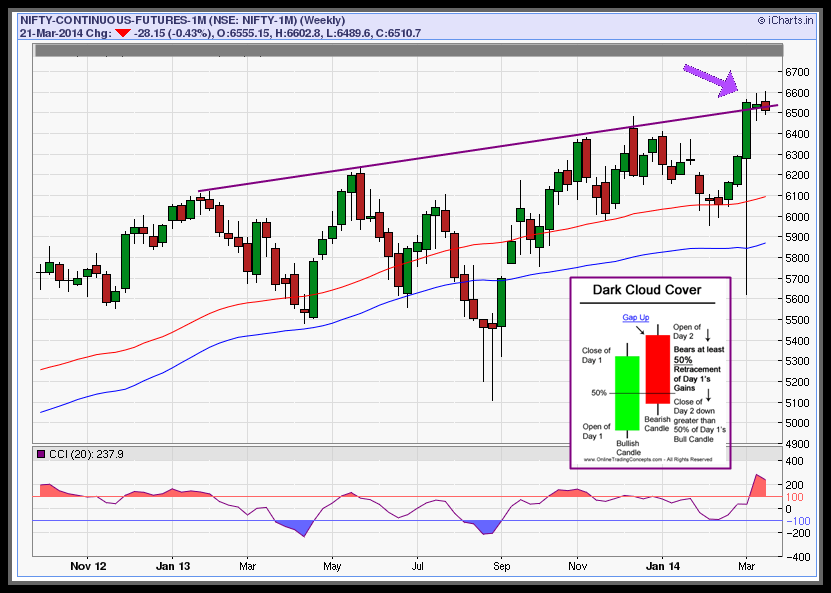
As per Nifty future weekly chart :-
1) Last candle closed below the positive breakout trend line.
2) Caldle stick pattern in weekly chart : Dark cloud cover.
3) Nifty future last candle closed below the weekly pivot point.
4) Very low volume with all time high candle.
So nifty future just make the "All time high" with only a short covering rally.
Its clearly witness Long term investors and high qty fund house not ready to invest at this level.
As per my chart reading experiance Nifty future if trade and hold below 6475 (Last week low + 14 pips for round number) i expect trend reversal for downside movement.
CLASSIC TECHNIQUES ~Pivot


 NIFTY/ BANK NIFTY Option Trade Tool (Buy/ Sell) based on Futures / Spot Prices