


Nifty spot analysis BY Santhosh2010
- Thread starter santhosh2010
- Start date
- Status
- Not open for further replies.
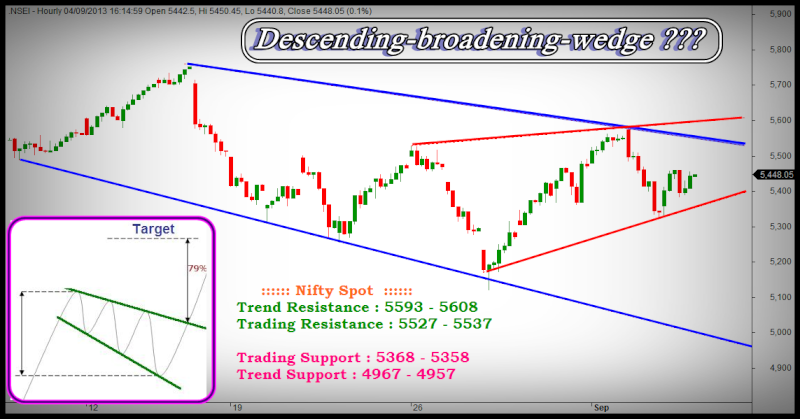
Nifty spot analysis 04/sep/2013 [vimalraj]
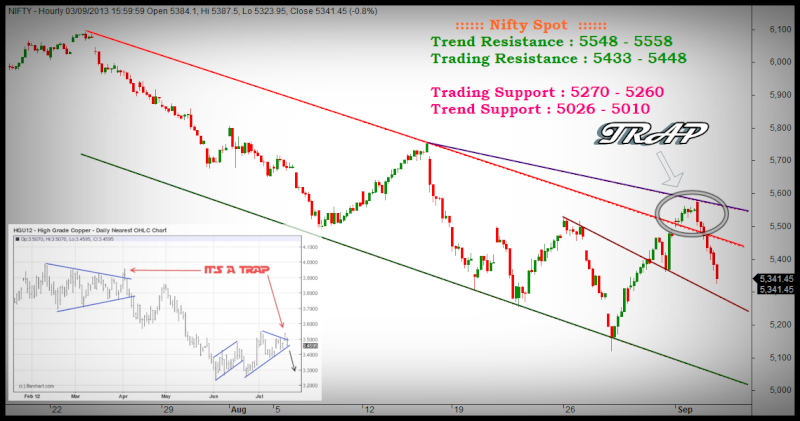
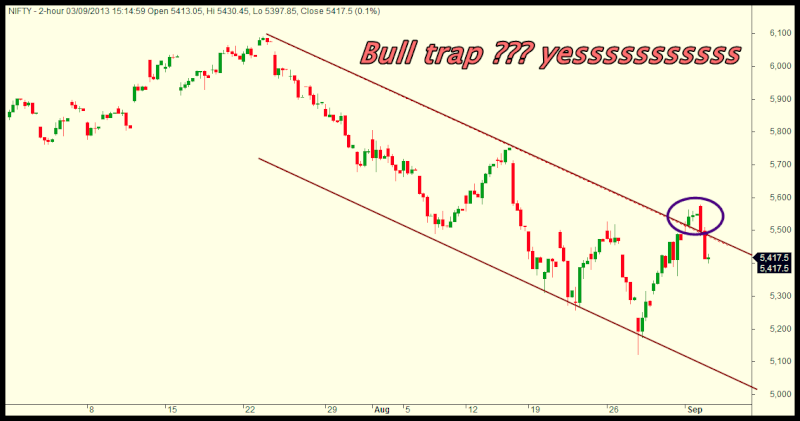
NIFTY SPOT POSITIONAL ANALYSIS
Nifty spot if hold below our trading resistance,Then ???
Yes no prob for short.hold positions...
nifty spot if trade and hold below our trading support,Then ???
yes. Already we expects downside Target : 5015.
~~~~~~~~~~~~~~~~~~~~~~~~~~~~~~~~~~~~~~~~~~
Closed position update :-
Nifty future long (5401) - Exit (5444) = + 43 points
Nifty 5400 pe :152.00 - Exit ( 137.00) = - 15 points
Nifty 5500 ce :102.00 - Exit (121.00) = + 19 points
Net Result : + 47 points * 2 lots = + 94 points.//Position closed.
~~~~~~~~~~~~~~~~~~~~~~~~~~~~~~~~~~
Open position update :-
Nifty future short (5396) - Cmp (5330) = + 66 points
Nifty 5400 ce long (163.00) - Cmp (128.00) = - 35 points
Nifty 5300 pe long (126.00) - Cmp ( 159.00) = + 33 points
Net Result in nifty future : + 64 points * 2 lots = + 128 points.//Position Open.
+++++++++++++++++++++++++++++++++++++++++++++++++++
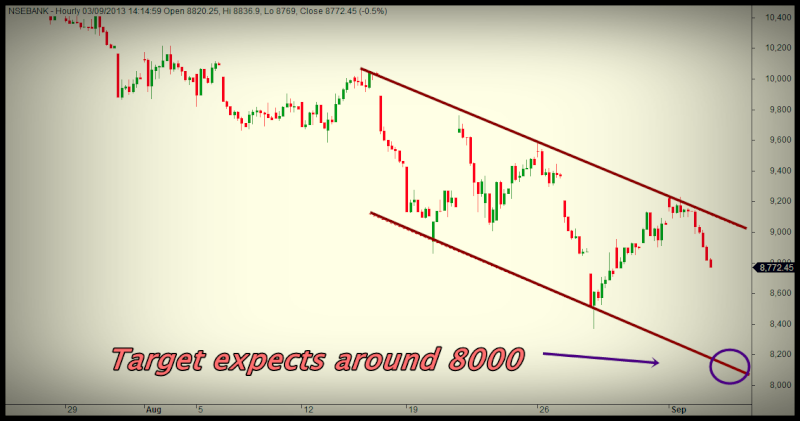
BankNifty future short (8925) - Cmp (8675) = + 250 points
BankNifty 9000 ce long (334.00) - Cmp (245.00) = - 89 points
BankNifty 8800 pe long (330.00) - Cmp ( 461.00) = + 131 points
Net Result in Banknifty future : + 292 points * 2 lots = + 584 points.//Position Open.
NIFTY SPOT POSITIONAL ANALYSIS
Nifty spot if hold below our trading resistance,Then ???
Yes no prob for short.hold positions...
nifty spot if trade and hold below our trading support,Then ???
yes. Already we expects downside Target : 5015.
~~~~~~~~~~~~~~~~~~~~~~~~~~~~~~~~~~~~~~~~~~
Closed position update :-
Nifty future long (5401) - Exit (5444) = + 43 points
Nifty 5400 pe :152.00 - Exit ( 137.00) = - 15 points
Nifty 5500 ce :102.00 - Exit (121.00) = + 19 points
Net Result : + 47 points * 2 lots = + 94 points.//Position closed.
~~~~~~~~~~~~~~~~~~~~~~~~~~~~~~~~~~
Open position update :-
Nifty future short (5396) - Cmp (5330) = + 66 points
Nifty 5400 ce long (163.00) - Cmp (128.00) = - 35 points
Nifty 5300 pe long (126.00) - Cmp ( 159.00) = + 33 points
Net Result in nifty future : + 64 points * 2 lots = + 128 points.//Position Open.
+++++++++++++++++++++++++++++++++++++++++++++++++++
BankNifty future short (8925) - Cmp (8675) = + 250 points
BankNifty 9000 ce long (334.00) - Cmp (245.00) = - 89 points
BankNifty 8800 pe long (330.00) - Cmp ( 461.00) = + 131 points
Net Result in Banknifty future : + 292 points * 2 lots = + 584 points.//Position Open.
Nifty spot analysis 05/sep/2013 [vimalraj]
NIFTY SPOT POSITIONAL ANALYSIS
Nifty spot if trade and hold above our trading resistance,Then ???
Yes we ready to take fresh longs...
Nifty spot if trade and hold below our trading support,Then ???
yes. now we get one fresh Target : 4967.
One who have nifty positions asper our update,Be ready anytime we will update our exit positions alert in market hours.
~~~~~~~~~~~~~~~~~~~~~~~~~~~~~~~~~~~~~~~~~~
Open position update :-
Nifty future short (5396) - Cmp (5450) = - 56 points
Nifty 5400 ce long (163.00) - Cmp (184.00) = + 21 points
Nifty 5300 pe long (126.00) - Cmp ( 109.00) = - 17 points
Net Result in nifty future : - 52 points * 2 lots = - 104 points.//Position Open.
+++++++++++++++++++++++++++++++++++++++++++++++++++
BankNifty future short (8925) - Cmp (8905) = + 20 points
BankNifty 9000 ce long (334.00) - Cmp (355.00) = + 21 points
BankNifty 8800 pe long (330.00) - Cmp (341.00) = + 11 points
Net Result in Banknifty future : + 52 points * 2 lots = + 104 points.//Position Open.
++++++++++++++++++++++++++++++++++++++++++++++++++++++++++++++++++++++++++
Descending Broadening Wedge
The descending broadening wedge is a bullish reversal pattern formed by two diverging downward slants. To confirm an descending broadening wedge, there must have oscillation between the two lines. Each line must be touched at least twice for validation.
This pattern marks the shortness of sellers. This one is characterized by a progressive reduction of the amplitude of the waves. Indeed, the pattern looks like a bearish channel on which the slope of the resistance is getting straight as far as the movement continues. In this pattern, the trend is bearish but sellers are struggling to keep control.
The target price is given by the lowest point that resulted in the formation of the wedge.
Here is a graphical representation of an descending broadening wedge:
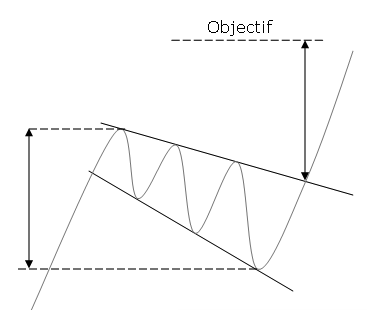
Here are some statistics about the descending broadening wedge:
- In 79% of cases, there is a upward exit
- In 66% of cases, the descending broadening wedge appear on a consolidation movement
- In 81% of cases, the target of the pattern is reached once the resistance broken
- In 40% of cases, a pullback occur on the resistance
Notes
In 76% of cases, the exit is made in the side of the movement that preceded the shaping of the descending broadening wedge
- Pullbacks are harmful for the performance of the pattern.
- Bullish breakouts are most effective when the price is located in the middle of the annual range
Trading Strategies
The classic strategy:
Entry: Take a long position at the breakout of the resistance
Stop: The stop is placed below the resistance line
Target: Theoretical target of the pattern
Advantage: The target of the pattern is often reached (in 81% of cases)
Disadvantage: There are many pullbacks (in 40% of cases)
The aggressive strategy:
Entry: Take a long position on a point of contact on the support
Stop: The stop is placed below the last lowest that has been done
Target: Theoretical target of the pattern
Advantage: In 79% of cases, the exit is upward
Disadvantage: The upward breakout is not yet confirmed
Thanks to : Fxtribe
NIFTY SPOT POSITIONAL ANALYSIS
Nifty spot if trade and hold above our trading resistance,Then ???
Yes we ready to take fresh longs...
Nifty spot if trade and hold below our trading support,Then ???
yes. now we get one fresh Target : 4967.
One who have nifty positions asper our update,Be ready anytime we will update our exit positions alert in market hours.
~~~~~~~~~~~~~~~~~~~~~~~~~~~~~~~~~~~~~~~~~~
Open position update :-
Nifty future short (5396) - Cmp (5450) = - 56 points
Nifty 5400 ce long (163.00) - Cmp (184.00) = + 21 points
Nifty 5300 pe long (126.00) - Cmp ( 109.00) = - 17 points
Net Result in nifty future : - 52 points * 2 lots = - 104 points.//Position Open.
+++++++++++++++++++++++++++++++++++++++++++++++++++
BankNifty future short (8925) - Cmp (8905) = + 20 points
BankNifty 9000 ce long (334.00) - Cmp (355.00) = + 21 points
BankNifty 8800 pe long (330.00) - Cmp (341.00) = + 11 points
Net Result in Banknifty future : + 52 points * 2 lots = + 104 points.//Position Open.
++++++++++++++++++++++++++++++++++++++++++++++++++++++++++++++++++++++++++
Descending Broadening Wedge
The descending broadening wedge is a bullish reversal pattern formed by two diverging downward slants. To confirm an descending broadening wedge, there must have oscillation between the two lines. Each line must be touched at least twice for validation.
This pattern marks the shortness of sellers. This one is characterized by a progressive reduction of the amplitude of the waves. Indeed, the pattern looks like a bearish channel on which the slope of the resistance is getting straight as far as the movement continues. In this pattern, the trend is bearish but sellers are struggling to keep control.
The target price is given by the lowest point that resulted in the formation of the wedge.
Here is a graphical representation of an descending broadening wedge:
Here are some statistics about the descending broadening wedge:
- In 79% of cases, there is a upward exit
- In 66% of cases, the descending broadening wedge appear on a consolidation movement
- In 81% of cases, the target of the pattern is reached once the resistance broken
- In 40% of cases, a pullback occur on the resistance
Notes
In 76% of cases, the exit is made in the side of the movement that preceded the shaping of the descending broadening wedge
- Pullbacks are harmful for the performance of the pattern.
- Bullish breakouts are most effective when the price is located in the middle of the annual range
Trading Strategies
The classic strategy:
Entry: Take a long position at the breakout of the resistance
Stop: The stop is placed below the resistance line
Target: Theoretical target of the pattern
Advantage: The target of the pattern is often reached (in 81% of cases)
Disadvantage: There are many pullbacks (in 40% of cases)
The aggressive strategy:
Entry: Take a long position on a point of contact on the support
Stop: The stop is placed below the last lowest that has been done
Target: Theoretical target of the pattern
Advantage: In 79% of cases, the exit is upward
Disadvantage: The upward breakout is not yet confirmed
Thanks to : Fxtribe
Last edited:
banknifty future if trade and hold above 9800 then fresh breakout target : 11850 ... now place stoploss order at : 9751 ..if sl hit then exit all banknifty open positions .. wait for fresh long entry updates...
nifty futureplace stoploss order at : 5651,if sl hit exit all open positions in nifty ...wait for fresh update...
nifty futureplace stoploss order at : 5651,if sl hit exit all open positions in nifty ...wait for fresh update...
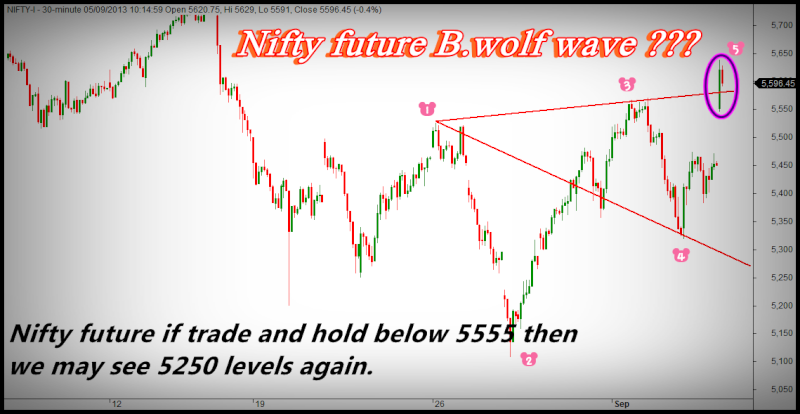
Nifty future buy above : 5651 (2 lots) [place stoploss buy order]
if nifty future buy order execute then
buy Nifty future 5600 put option 2 lots :
buy Nifty future 5700 call option 2 lots :
BankNifty future buy above : 9751 (2 lots) [place stoploss buy order]
if Banknifty future buy order execute then
buy BankNifty future 9700 put option 2 lots :
buy BankNifty future 9900 call option 2 lots :
Buy yesbank future 2 lots avove : 276.00
Buy yesbank 290 call 2 lots
buy yesbak 270 put option 2 lots
Nifty spot analysis 06/sep/2013 [vimalraj]
NIFTY SPOT POSITIONAL ANALYSIS
Nifty Spot if trade and close above our Trading resistance then,
yesssssss fresh breakout target our trend resistance.....
Nifty spot once if trade above our trading resistance
but its not hold above the trading resistance means
yessssss try to test our trading and trend support levels possible...
~~~~~~~~~~~~~~~~~~~~~~~~~~~~~~~~~~~~~~~~~~
Closed position update :-
BankNifty future Short (8925) - Exit (9710) = - 785 points
BankNifty 9000 ce : 334.00 - Exit ( 895.00) = + 561 points
BankNifty 8800 pe : 330.00 - Exit (133.00) = - 197 points
Net Result : - 431 points * 2 lots = - 864 points.//Position closed.
~~~~~~~~~~~~~~~~~~~~~~~~~~~~~~~~~~
Open position update :-
Nifty future short (5396) - Cmp (5601) = - 205 points
Nifty 5400 ce long (163.00) - Cmp (275.00) = + 112 points
Nifty 5300 pe long (126.00) - Cmp ( 59.00) = - 67 points
Net Result in Nifty Hedge: - 160 points * 2 lots = - 320 points.//Position Open.
++++++++++++++++++++++++++++++++++++++++++++++++++ +
Yesbank future long (276.00) - Cmp (292.00) = + 16 points
Yesbank 290 ce long (17.50) - Cmp (27.00) = + 9.50 points
Yesbank 270 pe long (19.00) - Cmp ( 16.20) = - 2.80 points
Net Result in Yesbank Hedge : + 22.70 points * 2 lots = + 45.40 points.//Position Open.
+++++++++++++++++++++++++++++++++++++++++++++++++++
BankNifty future long (9710) - Cmp (9722) = + 12 points
BankNifty 9700 pe : 389.00 - Cmp ( 400.00) = + 11 points
BankNifty 9900 ce : 308.00 - Cmp (335.00) = + 27 points
Net Result in Banknifty Hedge: + 50 points * 2 lots = +100 points.//Position Open.
~~~~~~~~~~~~~~~~~~~~~~~~~~~~~~~~~~~~~~~~~~
Todays position update :-
Nifty future place stoploss order at : 5651,if sl hit exit all open positions in nifty ....
Nifty future buy above : 5651 (2 lots) [place stoploss buy order]
if nifty future buy order execute then
buy Nifty future 5600 put option 2 lots :
buy Nifty future 5700 call option 2 lots :
~~~~~~~~~~~~~~~~~~~~~~~~~~~~~~~~~~~~~~~~~~~~~~~~~~~~~~~~~~~~~~~~~~~~~~~
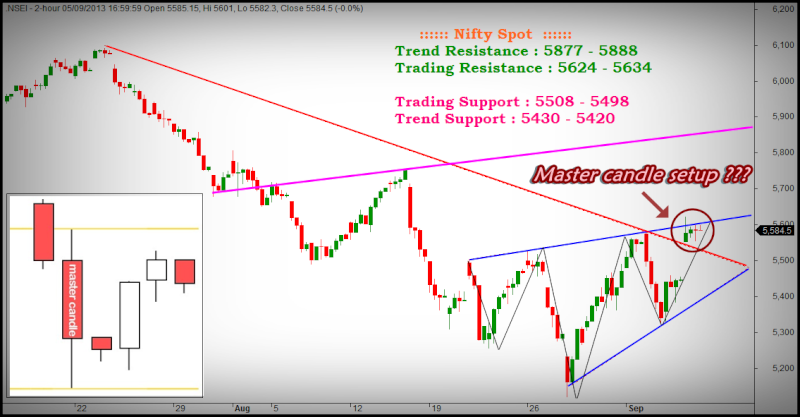
Master Candle
What is a Master Candle?
A master candle forms when a large candle makes a recent high and low that engulfs the following four or more candles. Take a look at the example below:

The minimum number of candles the master candle needs to engulf is four, but the more the better. When a master candle forms it is an area of support and resistance being set.
Why Are They Useful and What Do They Mean?
I find it is easiest to think of master candles as mini scalp lines. The high and low of the master candle represent recent areas of support and resistance. As candles form within the boundaries of the master candle the areas of support and resistance grow stronger. So trading master candles is like trading scalp lines or range breaks. The market falls into a range that is dictated by the high and low of the master candle. Once that high or low is broken the market
should rally. The more time before the break the stronger those boundaries become. Think about a master candle as a cross between support + resistance lines and candle patterns.
How Accurate are They?
Like any form of technical analysis, if you trade it alone and you blindly jump in without thinking you will lose. These patterns only work if the trader using them has a brain and is willing to use some discretion. A trading method only works if a real trader is trading it. So master candles can be as accurate as giving you 8 wins in every 10 trades using them. However, this will only be true if you use them in conjunction with other forms of analysis, common sense, and your brain.
What Makes a Strong Master Candle?
As with any form of analysis, some signals can be stronger than others. For example, when trading scalp lines a scalp line that has had three very strong, recent bounces is stronger than a scalp line with one weak bounce.
Let’s look at some of the things that make a master candle stronger:
1. Line Bounces
We know that the more bounces a scalp or support + resistance line has the stronger the line becomes. This is simply because every time the price
bounces away from that level it shows us that the level is a strong barrier. The more it bounces the stronger that barrier becomes. So when the price manages to eventually break that barrier it makes for a much better trade.
If the candles within the master candle bounce off of the high or low of the master candle it makes that high or low stronger. Therefore, a break of that high or low should make for a better trade, as the price should have a stronger than normal rally. Take a look at this example below:

Looking at the picture above you can see what I mean. The candles trapped within the boundaries of the master candle keep on testing the resistance lines. The more times the price rejects that line the stronger the line becomes.
2. Scalp or Support + Resistance Lines
If the master candles high or low happens to form on a pre existing scalp or support resistance line then that line becomes stronger. It becomes stronger because more than one form of analysis points to the same line being an area of support or resistance.
3. Psychological Levels
Same as above, if the master candles high or low happens to form on a strong psychological level Iwould consider the line stronger.
4. Time
The longer the master candle holds out the stronger it becomes. However, if it holds for too long I might consider it invalid. I give it about 24 hours to break. If it cannot break in 24 hours I scrap the master candle.
5. New highs or lows
If the high or low of a master candle doubles as a new daily, weekly, monthly, yearly or all time high or low it obviously makes the master candle stronger. Here is an example:

As you can see the master candle that formed on the 5th of December formed a new yearly low. I
would consider that line stronger than the line up top. This is just common sense.
So depending on how and where they form some master candles can be stronger than others.

This is so straight forward I do not know if it can be explained any more. The master candle forms a high and a low. When that high or low is broken the entry is triggered. However, as usual this breakout trading is a little different than most types of breakout trading. I like to use my brain when entering a breakout trade. I do not robotically enter the moment the line is broken. There are several factors that dictate whether or not I get into a trade, and if I get into the trade, when I get in.
Targets and Stops
Master candles are very subjective. Targets depend on where/when they form, market conditions, and line strength. Obviously if the master candles low forms on top of a strong support + resistance line the target on the break will be larger.
NIFTY SPOT POSITIONAL ANALYSIS
Nifty Spot if trade and close above our Trading resistance then,
yesssssss fresh breakout target our trend resistance.....
Nifty spot once if trade above our trading resistance
but its not hold above the trading resistance means
yessssss try to test our trading and trend support levels possible...
~~~~~~~~~~~~~~~~~~~~~~~~~~~~~~~~~~~~~~~~~~
Closed position update :-
BankNifty future Short (8925) - Exit (9710) = - 785 points
BankNifty 9000 ce : 334.00 - Exit ( 895.00) = + 561 points
BankNifty 8800 pe : 330.00 - Exit (133.00) = - 197 points
Net Result : - 431 points * 2 lots = - 864 points.//Position closed.
~~~~~~~~~~~~~~~~~~~~~~~~~~~~~~~~~~
Open position update :-
Nifty future short (5396) - Cmp (5601) = - 205 points
Nifty 5400 ce long (163.00) - Cmp (275.00) = + 112 points
Nifty 5300 pe long (126.00) - Cmp ( 59.00) = - 67 points
Net Result in Nifty Hedge: - 160 points * 2 lots = - 320 points.//Position Open.
++++++++++++++++++++++++++++++++++++++++++++++++++ +
Yesbank future long (276.00) - Cmp (292.00) = + 16 points
Yesbank 290 ce long (17.50) - Cmp (27.00) = + 9.50 points
Yesbank 270 pe long (19.00) - Cmp ( 16.20) = - 2.80 points
Net Result in Yesbank Hedge : + 22.70 points * 2 lots = + 45.40 points.//Position Open.
+++++++++++++++++++++++++++++++++++++++++++++++++++
BankNifty future long (9710) - Cmp (9722) = + 12 points
BankNifty 9700 pe : 389.00 - Cmp ( 400.00) = + 11 points
BankNifty 9900 ce : 308.00 - Cmp (335.00) = + 27 points
Net Result in Banknifty Hedge: + 50 points * 2 lots = +100 points.//Position Open.
~~~~~~~~~~~~~~~~~~~~~~~~~~~~~~~~~~~~~~~~~~
Todays position update :-
Nifty future place stoploss order at : 5651,if sl hit exit all open positions in nifty ....
Nifty future buy above : 5651 (2 lots) [place stoploss buy order]
if nifty future buy order execute then
buy Nifty future 5600 put option 2 lots :
buy Nifty future 5700 call option 2 lots :
~~~~~~~~~~~~~~~~~~~~~~~~~~~~~~~~~~~~~~~~~~~~~~~~~~~~~~~~~~~~~~~~~~~~~~~
Master Candle
What is a Master Candle?
A master candle forms when a large candle makes a recent high and low that engulfs the following four or more candles. Take a look at the example below:
The minimum number of candles the master candle needs to engulf is four, but the more the better. When a master candle forms it is an area of support and resistance being set.
Why Are They Useful and What Do They Mean?
I find it is easiest to think of master candles as mini scalp lines. The high and low of the master candle represent recent areas of support and resistance. As candles form within the boundaries of the master candle the areas of support and resistance grow stronger. So trading master candles is like trading scalp lines or range breaks. The market falls into a range that is dictated by the high and low of the master candle. Once that high or low is broken the market
should rally. The more time before the break the stronger those boundaries become. Think about a master candle as a cross between support + resistance lines and candle patterns.
How Accurate are They?
Like any form of technical analysis, if you trade it alone and you blindly jump in without thinking you will lose. These patterns only work if the trader using them has a brain and is willing to use some discretion. A trading method only works if a real trader is trading it. So master candles can be as accurate as giving you 8 wins in every 10 trades using them. However, this will only be true if you use them in conjunction with other forms of analysis, common sense, and your brain.
What Makes a Strong Master Candle?
As with any form of analysis, some signals can be stronger than others. For example, when trading scalp lines a scalp line that has had three very strong, recent bounces is stronger than a scalp line with one weak bounce.
Let’s look at some of the things that make a master candle stronger:
1. Line Bounces
We know that the more bounces a scalp or support + resistance line has the stronger the line becomes. This is simply because every time the price
bounces away from that level it shows us that the level is a strong barrier. The more it bounces the stronger that barrier becomes. So when the price manages to eventually break that barrier it makes for a much better trade.
If the candles within the master candle bounce off of the high or low of the master candle it makes that high or low stronger. Therefore, a break of that high or low should make for a better trade, as the price should have a stronger than normal rally. Take a look at this example below:
Looking at the picture above you can see what I mean. The candles trapped within the boundaries of the master candle keep on testing the resistance lines. The more times the price rejects that line the stronger the line becomes.
2. Scalp or Support + Resistance Lines
If the master candles high or low happens to form on a pre existing scalp or support resistance line then that line becomes stronger. It becomes stronger because more than one form of analysis points to the same line being an area of support or resistance.
3. Psychological Levels
Same as above, if the master candles high or low happens to form on a strong psychological level Iwould consider the line stronger.
4. Time
The longer the master candle holds out the stronger it becomes. However, if it holds for too long I might consider it invalid. I give it about 24 hours to break. If it cannot break in 24 hours I scrap the master candle.
5. New highs or lows
If the high or low of a master candle doubles as a new daily, weekly, monthly, yearly or all time high or low it obviously makes the master candle stronger. Here is an example:
As you can see the master candle that formed on the 5th of December formed a new yearly low. I
would consider that line stronger than the line up top. This is just common sense.
So depending on how and where they form some master candles can be stronger than others.
This is so straight forward I do not know if it can be explained any more. The master candle forms a high and a low. When that high or low is broken the entry is triggered. However, as usual this breakout trading is a little different than most types of breakout trading. I like to use my brain when entering a breakout trade. I do not robotically enter the moment the line is broken. There are several factors that dictate whether or not I get into a trade, and if I get into the trade, when I get in.
Targets and Stops
Master candles are very subjective. Targets depend on where/when they form, market conditions, and line strength. Obviously if the master candles low forms on top of a strong support + resistance line the target on the break will be larger.
open positions update : 06.09.2013
~~~~~~~~~~~~~~~~~~~~~~~~~~~~~~~~~~~~~~~~~~
Closed position update :-
Nifty future short (5396) - Closed (5651) = - 255 points
Nifty 5400 ce long (163.00) - Cmp (311.00) = + 148 points
Nifty 5300 pe long (126.00) - Cmp ( 48.00) = - 78 points
Net Result : - 185 points * 2 lots = - 370 points.//Position closed.
~~~~~~~~~~~~~~~~~~~~~~~~~~~~~~~~~~
Open position update :-
Nifty future long (5651) - Cmp (5695) = + 44 points
Nifty 5600 pe long (115.00) - Cmp (103.00) = - 12 points
Nifty 5700 ce long (109.00) - Cmp ( 135.00) = + 26 points
Net Result in Nifty Hedge: - 58 points * 2 lots = + 116 points.//Position Open.
++++++++++++++++++++++++++++++++++++++++++++++++++ +
Yesbank future long (276.00) - Cmp (292.00) = + 16 points
Yesbank 290 ce long (17.50) - Cmp (27.00) = + 9.50 points
Yesbank 270 pe long (19.00) - Cmp ( 16.20) = - 2.80 points
Net Result in Yesbank Hedge : + 22.70 points * 2 lots = + 45.40 points.//Position Open.
++++++++++++++++++++++++++++++++++++++++++++++++++ +
BankNifty future long (9710) - Cmp (9989) = + 279 points
BankNifty 9700 pe : 389.00 - Cmp ( 298.00) = - 91 points
BankNifty 9900 ce : 308.00 - Cmp (442.00) = + 134 points
Net Result in Banknifty Hedge: + 322 points * 2 lots = + 644 points.//Position Open.
~~~~~~~~~~~~~~~~~~~~~~~~~~~~~~~~~~~~~~~~~~
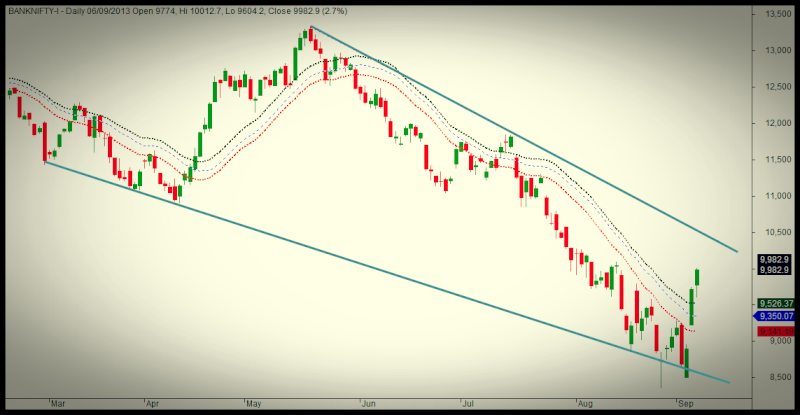
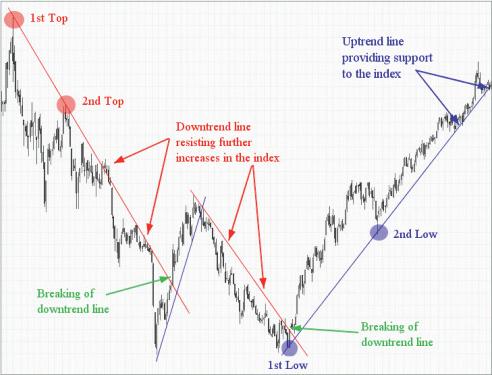
TRADE WITH TREND LINES
How to draw trendline
++++++++++++++++++++++++++++++++++++++++
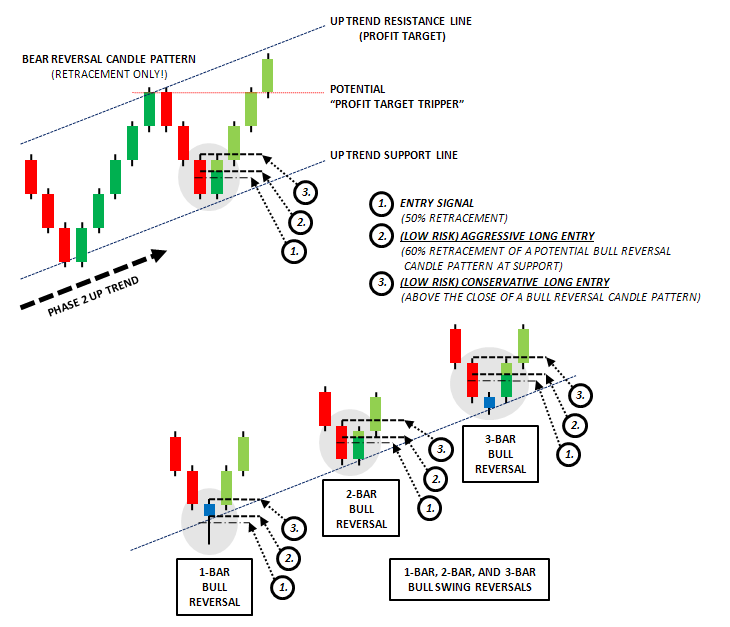
LONG Swing Entry Trade Setup
~~~~~~~~~~~~~~~~~~~~~~~~~~~~
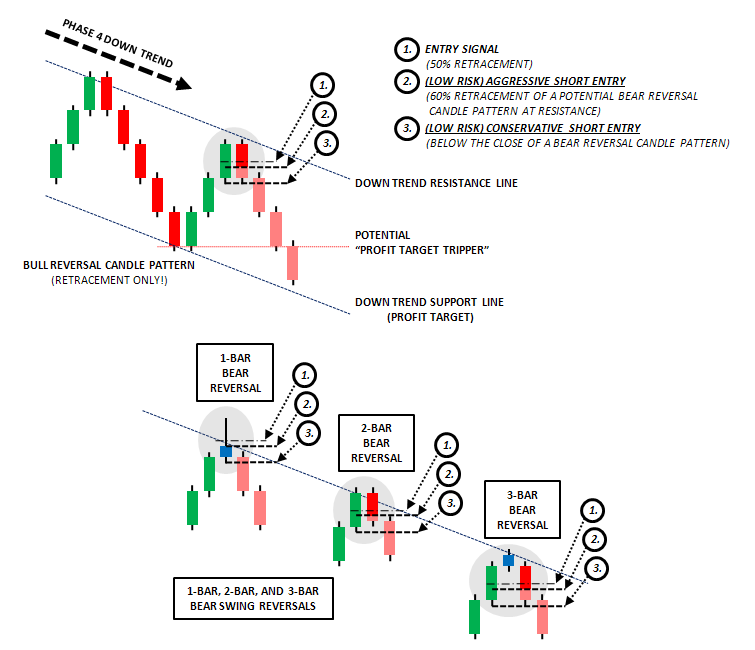
SHORT Swing Entry Trade Setup
~~~~~~~~~~~~~~~~~~~~~~~~~~~~~~~~~~~~~~~~~~
Closed position update :-
Nifty future short (5396) - Closed (5651) = - 255 points
Nifty 5400 ce long (163.00) - Cmp (311.00) = + 148 points
Nifty 5300 pe long (126.00) - Cmp ( 48.00) = - 78 points
Net Result : - 185 points * 2 lots = - 370 points.//Position closed.
~~~~~~~~~~~~~~~~~~~~~~~~~~~~~~~~~~
Open position update :-
Nifty future long (5651) - Cmp (5695) = + 44 points
Nifty 5600 pe long (115.00) - Cmp (103.00) = - 12 points
Nifty 5700 ce long (109.00) - Cmp ( 135.00) = + 26 points
Net Result in Nifty Hedge: - 58 points * 2 lots = + 116 points.//Position Open.
++++++++++++++++++++++++++++++++++++++++++++++++++ +
Yesbank future long (276.00) - Cmp (292.00) = + 16 points
Yesbank 290 ce long (17.50) - Cmp (27.00) = + 9.50 points
Yesbank 270 pe long (19.00) - Cmp ( 16.20) = - 2.80 points
Net Result in Yesbank Hedge : + 22.70 points * 2 lots = + 45.40 points.//Position Open.
++++++++++++++++++++++++++++++++++++++++++++++++++ +
BankNifty future long (9710) - Cmp (9989) = + 279 points
BankNifty 9700 pe : 389.00 - Cmp ( 298.00) = - 91 points
BankNifty 9900 ce : 308.00 - Cmp (442.00) = + 134 points
Net Result in Banknifty Hedge: + 322 points * 2 lots = + 644 points.//Position Open.
~~~~~~~~~~~~~~~~~~~~~~~~~~~~~~~~~~~~~~~~~~
TRADE WITH TREND LINES
How to draw trendline
++++++++++++++++++++++++++++++++++++++++
LONG Swing Entry Trade Setup
~~~~~~~~~~~~~~~~~~~~~~~~~~~~
SHORT Swing Entry Trade Setup
- Status
- Not open for further replies.
Similar threads
-
 NIFTY/ BANK NIFTY Option Trade Tool (Buy/ Sell) based on Futures / Spot Prices
- Started by allex418
- Replies: 7
-
21500 points in banknifty spot in 13 months, will this survive post charges and slippage
- Started by Utkarsh Gupta007
- Replies: 1
-

-
-