


Nifty spot analysis BY Santhosh2010
- Thread starter santhosh2010
- Start date
- Status
- Not open for further replies.
What awesome
Just copy pasted from a blog, without giving due acknowledgement to the original.
Just copy pasted from a blog, without giving due acknowledgement to the original.
atleast he copy paste here so that novices like us can learn .................
u also know these things have u done it for helping us ?
it's easy to criticize but is it easy to help other's
whatever the motive (pubilicity , business) of the author (santosh2010) atleast he is posting here , ,
in reality by seeing his charts , i had developed a new insight ...................
i know u r also a great ww trader and posting good charts there ,
but u know internet is vast ocean of knowledge ,
every person here or there has copy pasted insights , materials ............
so plz take it in positive way , no offend to u ...............just posted as on the way ......
plz don't offend a1b1trader.................
atleast he copy paste here so that novices like us can learn .................
u also know these things have u done it for helping us ?
it's easy to criticize but is it easy to help other's
whatever the motive (pubilicity , business) of the author (santosh2010) atleast he is posting here , ,
in reality by seeing his charts , i had developed a new insight ...................
i know u r also a great ww trader and posting good charts there ,
but u know internet is vast ocean of knowledge ,
every person here or there has copy pasted insights , materials ............
so plz take it in positive way , no offend to u ...............just posted as on the way ......
To feel offended, certainly not until it is on personal level.
I know Santosh by many different names.
I know he is a very knowledgeable person.
I know he is a very helpful person, always ready to help.
You ask for some help.
He will provide it in no time if he has it.
I know he is running a business based on stock market.
Even if he is doing all this for gaining business purpose, it is none of my business to point it out. We all are doing business here (trading is a business) and are here for monetary gains.
I also admire him like you admire him for his work and help, perhaps may be more than you.
Nothing against him, as a person.
You have rightly said that internet is a vast ocean.
I am not against copy pasting, no one can know everything.
I just want to point out that when we lift something from internet for copy pasting, we, at least, should give due credit to the original. So that it doesnt look like that the work is ones own.
So, you are also one of the silent reader of the WW thread.

What awesome
Just copy pasted from a blog, without giving due acknowledgement to the original.
Just copy pasted from a blog, without giving due acknowledgement to the original.
The strategy he post's now is very simple, which means in no way that it is bad: This time it is a long strangle with the strike above and under the trend line or resistance line shown in his copy past charts. Then the idea is to add the future leg on the side he hopes market will go. All of us can do that with even making any copy past post. In an other thread, under his name, he was posting the copy past idea about a long straddle at resistance or support and then adds the leg on the side market should move. In some way good strategies, but selling them here as his ideas, not even showing the link he makes copy past from, makes the thread smelling.
An other thing I wondering: You posted: I know Santosh by many different names. So what is his problem to do so? If he runs some kind of business which is build on the share market, no problem with that. But always past copy, not even having the guts to show the links and also coming up under different names: Hey sorry, who is that guy
Any way: We are all free to read here or to move around. After seeing TP post in an other thread about that thread, subcribed today and deleted my subscriptions very quickly after seeing all the above posts.
Take care / DanPickUp
Nifty spot analysis 10/sep/2013 [vimalraj]
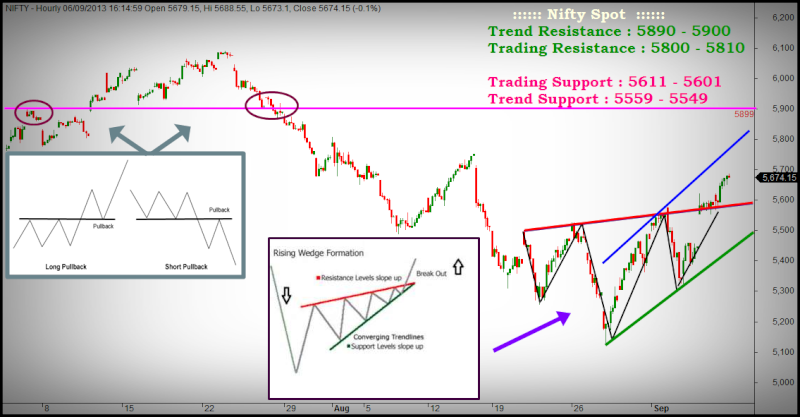
NIFTY SPOT POSITIONAL ANALYSIS
Nifty Spot if trade and close above our Trading Support then,
yesssssss no prob for nifty long ...hold .... Target maybe our trading and trend resistance.....
+++++++++++++++++++++++++++++++++++++++
Today's position orders update :-
Nifty 5700 call option place Sell order at : 224.00
Banknifty 9900 Call option place Sell order at : 695.00
Yesbank 290 Call option place Sell order at : 36.00
~~~~~~~~~~~~~~~~~~~~~~~~~~~~~~~~~~~
Rising Wedge Futures Trading Chart Pattern
http://www.thepatternsite.com/risewedge.html
~~~~~~~~~~~~~~~~~~~~~~~~~~~~~~~~~~~~~~~~~~
Fundamental and Technical Analysis :-
There are two popular methods people use:
1: The company price trend (through Technical Analysis)
2: The company earnings and balance sheet (through Fundamental Analysis)
Of course there are other ways to analyse a stock, such as quantified trading systems, the direction of the overall market (i.e. are we in a bull market or bear market?), moon phases or even football scores. *The reason we’ve included mainly fundamental and technical analysis is that many people start out trying to determine if the company they are buying is a solid one. *After all, if it has good earnings and a solid balance sheet, it should go up right? *Not always. *And that is why we look at the price trend as well.
All too often a company with good fundamentals can trend down, losing money for its investors. *And just as often, a company with a terrible balance sheet might rocket to the sky, making thousands for its investors. *This is why we must always test or quantify our method before using it.
Fundamental Analysis:
Looking at a company’s earnings, debt, assets and liabilities is called fundamental analysis. *Your stock broker will have this information for you to view, either online of via their broker reports.
The idea behind fundamental analysis that by buying companies with a strong balance sheet, solid earnings, and controllable debt, the share price is more likely to go up. *Buying strong companies is good in theory, but fundamental analysts must be aware that even strong companies can go down in price when other factors are involved (like a bear market, for example), and often a company’s earnings results are made public long after other investors have sold the share causing it to fall.
Technical Analysis :
Looking at a companys price history and volume is called technical analysis. *The most common way to do this is with a price chart, which shows the history in price of a company or market. *Often you can see years and decades of history for a stock in a price chart, which allows you to test your technical analysis theories to see if they work.
The idea in technical analysis is to identify patterns or tools that give you a high probability that the price will continue upwards. *Examples of this would be price crossing above a trend line, or a moving average as a signal to buy. *Practitioners of technical analsysis should be aware that nothing works 100% of the time: it merely gives you a higher probability of success.
Popular Fundamental Analysis Tools :-
Analysing a company’s balance sheet is one of the oldest and most common ways to analyse a stock market share. *Many new investors start out with this method because it makes sense. *After all, if a company is doing well financially on its balance sheet, the respective share price should go up, right? *Well, while there are often other factors involved, it is certainly a great place to start.
The likes of Benjamin Graham, Phil Fisher, Warren Buffett have all used and advocated the use of company statistics and fundamentals in their investing success. *Below are ten popular fundamental analysis tools, and what they mean. *Enjoy!
Popular Fundamental Analysis Tools :-
1: Dividend Yield And Franking Credit
The dividend yield is the amount the company has paid out as a dividend percentage over the last 12 months. *A great piece of information for people who invest for yearly income, the most common dividend yield is between 2% and 7% when a company has one.
Also in this information is the company’s franking amount. *As a company often pays tax on its earnings (at around 30%), often this amount can be offset when they distribute a dividend, by way of a franking credit. *A company with 100% franking, for example, can give you the full 30% credit against the dividend payment on your next tax return.
2: Earnings Per Share
The Earnings Per Share or EPS is how many cents the company earns per share. *For example, a company with an EPS of 120 will have earned 120 cents or $1.20 for each share in the last 12 months.
This is a good measure to see if the company is earning its way effectively. *Obviously, the higher a company’s earnings relative to its share price, the better buy it may be.
3: Earnings Per Share 1 Year Growth
It is good to see a company with solid earnings per share, but we also want our company to be growing and not going backwards.
Therefore, a company with a good EPS 1 Year Growth percentage is a good thing to look out for. *Obviously one that is growing at 50% might be a better buy than one that is growing at only 5%.
4: Cashflow Per Share
Cashflow is often used to gauge a company’s performance, and has been referred to as the life blood of any business. *Many analysts believe that it is easy to manipulate earnings per share, but much more difficult to manipulate the cash on hand. *Also, if a company does not have enough cash on hand to support its operations, it is more likely to become insolvent.
5: Cashflow 1 Year Growth
As it is important for a company to have ample cash on hand, so too it is important to see that the cashflow of a company is growing.
6: Price to Book (PB) Ratio
The Price to Book ratio is the price of the share relative to all of the company’s assets. *If the P/B ratio is less than one then it is said that the share price is less than that of its combined assets, and a candidate for good “value”. *Of course a Price to Book ratio of greater than one indicates that the market is taking into consideration other factors, like potential future earnings.
A study by a United States account found that investing with the Price to Book ratio alone (less than 1) yielded a success rate of 44% wins overall. *However the annual return on those wins was so great that it made up for all the the companies that went down and resulted in a stunning annual performance of 23% p.a. over 20 years.
7: Price to Earnings (PE) Ratio
The Price to Earnings Ratio is one of the best known financial ratios in Fundamental Analysis. *As it is the price relative to the company earnings per share, often investors will advocate that the lower the ratio the better.
For example, a company with earnings of 20 cents per share, trading at $1.00 per share, will have a ratio of (100 / 20 = 5) five. *Obviously if you could invest in a company that was making 20 cents in the dollar it would be seen as a good buy. *The average P/E Ratio over the years is around 14, and many value investors will go for a ratio of less than 10.
8: P/E Growth Ratio
The P/E Growth ratio or PEG ratio is the P/E of a share divided by its annual EPS growth. *It can be done using the current EPS growth or projected EPS growth.
For example, a company with a P/E of *11 and 39% 1 Year EPS Growth would be: 11 / 39 = 0.28. *It is said that a company with a PEG of 1 is at fair value, less than one would be considered good value, and greater than one would be considered “expensive”.
9: Interest Cover
The Interest Cover is the amount of times a company’s earnings (before interest and tax) covers the interest on their debts. *For example a company that earns 50 cents per share and pays out 5 cents per share in interest on its debts, would have an interest cover of 10.
A negative interest cover is often to be avoided when looking at shares using fundamental analysis, as it may mean that the company is not earning enough to meet its current fixed interest obligations.
10: Debt To Equity Ratio
Often displayed as a percentage, the debt to equity ratio is the percentage of debt to a company’s equity. *For example a company with a debt to equity of 38% will have just that: 38% of debt against its equity.
Obviously some debt is good and healthy, but significant debt can be toxic. *Many investors will look for amounts around 20% to 50%.
Popular Technical Analysis Tools
Technical Analysis is the act of using a share price and volume to determine places to buy and sell. *While it used to be a relatively simple style of analysis, with the invention of computers its use has increased and has become both more simple and more complex. *Simple in that we can now with some programs scan entire markets for a technical signal in under 5 minutes. *Complex, in that technical analysts have invented more complex ways to combine price and volume in order to get what they believe might be a superior result. *Most technical analysis is still, at its core, made up of price and volume.
Below we will look at *ten popular technical anlalysis tools, ranging from simple tools anyone can draw on a chart through to the more complex computerised ones. *Enjoy!
1: Trend Lines
Trend lines are very simply, a line on a chart. *On a simple bar chart a down trend line is drawn over two or more peaks. *An up trend line is drawn over 2 or more troughs. *Traders and investors will often take price crossing above a trend line as a signal to buy, or price crossing below an up trend line as a signal to sell.
The benefits of trend lines are they are very easy to draw, use and learn, and can get you into and out of trades before other methods.
2: Moving Averages
A moving average is a plot on a bar chart that shows you the average of the last “x” amount of days, weeks, months or years. *To give you an example, a 50 day moving average would be a line on your bar chart that shows the average of the last 50 days in price. *As the price moves and changes, so does the moving average.
Many traders and investors use moving averages as buy and sell signals, as support and resistance or with another moving average or combination where one crossing above another is a buy or sell signal. *Moving averages have been used as part of many automatic trading systems over the years, and can also be separated into Exponential Moving Averages (EMA) where more weight is given to the more recent data, and Simple Moving Averages (MA).
3: Support And Resistance
Price support and resistance is often used by technical analysts for good reason. *Places where large buyers buy and sell become points of support and resistance in the market due to simple laws of supply and demand (i.e. if there are large sellers at a particular price point, it will be hard for the price to rise above this point).
4: Dow’s Theory
Charles Dow’s theory from the late 1800s was three parts: First that the market moves up and down in three phases, from hope, earnings, to euphoria, then from abandonment of hope, lack of earnings, to despair. *Second is his “higher peaks and higher troughs” theory, which according to Dow constitutes a bull market. *Conversely, lower peaks and lower troughs in price would constitute a bear market. *And lastly, the Dow Industrials average and the Dow Transports average ideally make new highs at similar times. *If the Industrials average makes a new high but the Transports does not, it indicates to Dow that there is not as much demand for the goods being manufactured.
5: Fibonnacci Numbers
Leonardo Fibonacci, the Italian economist who introduced the decimal number system to Europe in the 1200s, also invented a number series that was found all throughout the universe: in nature, cells, economics, and life. *The numbers are found by adding the last two numbers in the sequence together, for example: 1, 1, 2, 3, 5, 8, 13, 21, 34, 55, 89, and so on. *Dividing a number by its predecessor (i.e. 89 / 55) gives us the “golden mean”, or 1.618. *Now (starting from 0.236 or 23.6%) multiplying onward by 1.618 this gives you a series of percentages, and Technical Analysts around the world have found that the market tends to find support and resistance in the future at and around these percentages!
6: Elliott Wave Theory
Taking Fibonacci and Dow’s Theory one step further was Ralph Elliott, an accountant who became ill and bedridden late in his life, and turned his attention to the stock market. *He formed a theory that consisted of five moves or ”waves” upward, and three waves down. *The theory followed closely what Charles Dow had discovered nearly 50 years before, however Elliott now added the Fibonacci percentages to his analysis, allowing him to “predict” future turning points in the stock market based on the price action.
7: Candlesticks
Munehisa Homma was a very successful rice trader in Japan during the 1700s, generating over 100 billion dollars of profit in todays prices. *He formed a theory for trading and analysing the market which has become known as candlestick charting. *There are more than 20 candlestick “patterns” that evolve in the market, and many more ways to trade with them. *The main draw card for new traders and investors is the way the price is drawn, with a thick body coloured either black or white depending on which way the price closes. *As the picture shows, the bars look like candles, hence the name.
8: Highest Highs, Lowest Lows
While not so much a theory in itself, using a highest high of the last ”x” days (or weeks, months) has been used independantly by many great and successful technical analysts, especially in the areas of Trend Following and Automatic Trading Systems. *Richard Donchian pioneered one method that used four week highs and four week lows to buy and sell. *William O’Neil of Market Wizards fame also used a 52 week high signal as a part of his trading and investing, all with great success. *Using highest highs is also very easy to program and optimize for automatic trading system use.
9: Relative Strength Index (RSI)
The Relative Strength Index is an “Oscillator” that is used to measure the rate of change in price. *It compares market up days and market down days within a specified period and indexes the results between 0 and 100. *The result is, over “x” periods, how many days finished with a closing price above the previous trading day compared to how many days finished with a closing price below the previous trading day.
People who use the RSI often use 30 and 70 as triggers for “oversold” and “overbought” levels.
10: Stochastic
The Stochastic indicator is a momentum oscillator that compares the latest closing price of a security to the lowest low and highest high over a given period. *The resultant figure is called %K, and is displayed as a solid line. *Then %D which is a 3 day Simple Moving Average of %K, and often used as a slow stochastic or as a basis for crossover signals with %K.
Like the RSI, the Stochasic will oscillate between 0 and 100, and levels above 80 or below 20 are often used as “overbought” or “oversold” levels.
11: Parabolic Stop And Reverse
The Parabolic SAR is a trend following indicator that is often used to identify entry and exit points, including a stop loss and trailing stop loss as the trade unfolds. *As the parabolic SAR moves up with the price it provides the perfect trailing stop loss. *Once the stop loss is hit, the Parabolic SAR reverses and now gives a stop loss on the top side of price. *The Parabolic SAR is useful in trending markets, and often used in trend following automatic trading systems.
12: Bollinger Bands
Invented by John Bollinger in the 1970s just as computers were making their way into finance, Bollinger Bands consist of a moving average, and then a moving average above and below it (usually “x” standard deviations above and below the middle moving average).
What this does is give a “band” that price often moves within. *If price is nearing or touches the top of the band, it is considered likely to fall to be back within the band. *Likewise, price nearing or touching the bottom of the band is considered more likely to rise to be back within the confines of the band. *Bollinger Bands also act as a volatility measure, naturally widening during times of high volatility, and shrinking during times of consolidation.
Thanks to : ASXDave
Last edited:
Re: Nifty spot analysis 10/sep/2013 [vimalraj]
:clap:
NIFTY SPOT POSITIONAL ANALYSIS
Nifty Spot if trade and close above our Trading Support then,
yesssssss no prob for nifty long ...hold .... Target maybe our trading and trend resistance.....
+++++++++++++++++++++++++++++++++++++++
Today's position orders update :-
Nifty 5700 call option place Sell order at : 124.00
Banknifty 9900 Call option place Sell order at : 695.00
Yesbank 290 Call option place Sell order at : 36.00
~~~~~~~~~~~~~~~~~~~~~~~~~~~~~~~~~~~~~~~~~~
Fundamental and Technical Analysis :-
There are two popular methods people use:
1: The company price trend (through Technical Analysis)
2: The company earnings and balance sheet (through Fundamental Analysis)
Of course there are other ways to analyse a stock, such as quantified trading systems, the direction of the overall market (i.e. are we in a bull market or bear market?), moon phases or even football scores. *The reason we’ve included mainly fundamental and technical analysis is that many people start out trying to determine if the company they are buying is a solid one. *After all, if it has good earnings and a solid balance sheet, it should go up right? *Not always. *And that is why we look at the price trend as well.
All too often a company with good fundamentals can trend down, losing money for its investors. *And just as often, a company with a terrible balance sheet might rocket to the sky, making thousands for its investors. *This is why we must always test or quantify our method before using it.
Fundamental Analysis:
Looking at a company’s earnings, debt, assets and liabilities is called fundamental analysis. *Your stock broker will have this information for you to view, either online of via their broker reports.
The idea behind fundamental analysis that by buying companies with a strong balance sheet, solid earnings, and controllable debt, the share price is more likely to go up. *Buying strong companies is good in theory, but fundamental analysts must be aware that even strong companies can go down in price when other factors are involved (like a bear market, for example), and often a company’s earnings results are made public long after other investors have sold the share causing it to fall.
Technical Analysis :
Looking at a companys price history and volume is called technical analysis. *The most common way to do this is with a price chart, which shows the history in price of a company or market. *Often you can see years and decades of history for a stock in a price chart, which allows you to test your technical analysis theories to see if they work.
The idea in technical analysis is to identify patterns or tools that give you a high probability that the price will continue upwards. *Examples of this would be price crossing above a trend line, or a moving average as a signal to buy. *Practitioners of technical analsysis should be aware that nothing works 100% of the time: it merely gives you a higher probability of success.
Popular Fundamental Analysis Tools :-
Analysing a company’s balance sheet is one of the oldest and most common ways to analyse a stock market share. *Many new investors start out with this method because it makes sense. *After all, if a company is doing well financially on its balance sheet, the respective share price should go up, right? *Well, while there are often other factors involved, it is certainly a great place to start.
The likes of Benjamin Graham, Phil Fisher, Warren Buffett have all used and advocated the use of company statistics and fundamentals in their investing success. *Below are ten popular fundamental analysis tools, and what they mean. *Enjoy!
Popular Fundamental Analysis Tools :-
1: Dividend Yield And Franking Credit
The dividend yield is the amount the company has paid out as a dividend percentage over the last 12 months. *A great piece of information for people who invest for yearly income, the most common dividend yield is between 2% and 7% when a company has one.
Also in this information is the company’s franking amount. *As a company often pays tax on its earnings (at around 30%), often this amount can be offset when they distribute a dividend, by way of a franking credit. *A company with 100% franking, for example, can give you the full 30% credit against the dividend payment on your next tax return.
2: Earnings Per Share
The Earnings Per Share or EPS is how many cents the company earns per share. *For example, a company with an EPS of 120 will have earned 120 cents or $1.20 for each share in the last 12 months.
This is a good measure to see if the company is earning its way effectively. *Obviously, the higher a company’s earnings relative to its share price, the better buy it may be.
3: Earnings Per Share 1 Year Growth
It is good to see a company with solid earnings per share, but we also want our company to be growing and not going backwards.
Therefore, a company with a good EPS 1 Year Growth percentage is a good thing to look out for. *Obviously one that is growing at 50% might be a better buy than one that is growing at only 5%.
4: Cashflow Per Share
Cashflow is often used to gauge a company’s performance, and has been referred to as the life blood of any business. *Many analysts believe that it is easy to manipulate earnings per share, but much more difficult to manipulate the cash on hand. *Also, if a company does not have enough cash on hand to support its operations, it is more likely to become insolvent.
5: Cashflow 1 Year Growth
As it is important for a company to have ample cash on hand, so too it is important to see that the cashflow of a company is growing.
6: Price to Book (PB) Ratio
The Price to Book ratio is the price of the share relative to all of the company’s assets. *If the P/B ratio is less than one then it is said that the share price is less than that of its combined assets, and a candidate for good “value”. *Of course a Price to Book ratio of greater than one indicates that the market is taking into consideration other factors, like potential future earnings.
A study by a United States account found that investing with the Price to Book ratio alone (less than 1) yielded a success rate of 44% wins overall. *However the annual return on those wins was so great that it made up for all the the companies that went down and resulted in a stunning annual performance of 23% p.a. over 20 years.
7: Price to Earnings (PE) Ratio
The Price to Earnings Ratio is one of the best known financial ratios in Fundamental Analysis. *As it is the price relative to the company earnings per share, often investors will advocate that the lower the ratio the better.
For example, a company with earnings of 20 cents per share, trading at $1.00 per share, will have a ratio of (100 / 20 = 5) five. *Obviously if you could invest in a company that was making 20 cents in the dollar it would be seen as a good buy. *The average P/E Ratio over the years is around 14, and many value investors will go for a ratio of less than 10.
8: P/E Growth Ratio
The P/E Growth ratio or PEG ratio is the P/E of a share divided by its annual EPS growth. *It can be done using the current EPS growth or projected EPS growth.
For example, a company with a P/E of *11 and 39% 1 Year EPS Growth would be: 11 / 39 = 0.28. *It is said that a company with a PEG of 1 is at fair value, less than one would be considered good value, and greater than one would be considered “expensive”.
9: Interest Cover
The Interest Cover is the amount of times a company’s earnings (before interest and tax) covers the interest on their debts. *For example a company that earns 50 cents per share and pays out 5 cents per share in interest on its debts, would have an interest cover of 10.
A negative interest cover is often to be avoided when looking at shares using fundamental analysis, as it may mean that the company is not earning enough to meet its current fixed interest obligations.
10: Debt To Equity Ratio
Often displayed as a percentage, the debt to equity ratio is the percentage of debt to a company’s equity. *For example a company with a debt to equity of 38% will have just that: 38% of debt against its equity.
Obviously some debt is good and healthy, but significant debt can be toxic. *Many investors will look for amounts around 20% to 50%.
Popular Technical Analysis Tools
Technical Analysis is the act of using a share price and volume to determine places to buy and sell. *While it used to be a relatively simple style of analysis, with the invention of computers its use has increased and has become both more simple and more complex. *Simple in that we can now with some programs scan entire markets for a technical signal in under 5 minutes. *Complex, in that technical analysts have invented more complex ways to combine price and volume in order to get what they believe might be a superior result. *Most technical analysis is still, at its core, made up of price and volume.
Below we will look at *ten popular technical anlalysis tools, ranging from simple tools anyone can draw on a chart through to the more complex computerised ones. *Enjoy!
1: Trend Lines
Trend lines are very simply, a line on a chart. *On a simple bar chart a down trend line is drawn over two or more peaks. *An up trend line is drawn over 2 or more troughs. *Traders and investors will often take price crossing above a trend line as a signal to buy, or price crossing below an up trend line as a signal to sell.
The benefits of trend lines are they are very easy to draw, use and learn, and can get you into and out of trades before other methods.
2: Moving Averages
A moving average is a plot on a bar chart that shows you the average of the last “x” amount of days, weeks, months or years. *To give you an example, a 50 day moving average would be a line on your bar chart that shows the average of the last 50 days in price. *As the price moves and changes, so does the moving average.
Many traders and investors use moving averages as buy and sell signals, as support and resistance or with another moving average or combination where one crossing above another is a buy or sell signal. *Moving averages have been used as part of many automatic trading systems over the years, and can also be separated into Exponential Moving Averages (EMA) where more weight is given to the more recent data, and Simple Moving Averages (MA).
3: Support And Resistance
Price support and resistance is often used by technical analysts for good reason. *Places where large buyers buy and sell become points of support and resistance in the market due to simple laws of supply and demand (i.e. if there are large sellers at a particular price point, it will be hard for the price to rise above this point).
4: Dow’s Theory
Charles Dow’s theory from the late 1800s was three parts: First that the market moves up and down in three phases, from hope, earnings, to euphoria, then from abandonment of hope, lack of earnings, to despair. *Second is his “higher peaks and higher troughs” theory, which according to Dow constitutes a bull market. *Conversely, lower peaks and lower troughs in price would constitute a bear market. *And lastly, the Dow Industrials average and the Dow Transports average ideally make new highs at similar times. *If the Industrials average makes a new high but the Transports does not, it indicates to Dow that there is not as much demand for the goods being manufactured.
5: Fibonnacci Numbers
Leonardo Fibonacci, the Italian economist who introduced the decimal number system to Europe in the 1200s, also invented a number series that was found all throughout the universe: in nature, cells, economics, and life. *The numbers are found by adding the last two numbers in the sequence together, for example: 1, 1, 2, 3, 5, 8, 13, 21, 34, 55, 89, and so on. *Dividing a number by its predecessor (i.e. 89 / 55) gives us the “golden mean”, or 1.618. *Now (starting from 0.236 or 23.6%) multiplying onward by 1.618 this gives you a series of percentages, and Technical Analysts around the world have found that the market tends to find support and resistance in the future at and around these percentages!
6: Elliott Wave Theory
Taking Fibonacci and Dow’s Theory one step further was Ralph Elliott, an accountant who became ill and bedridden late in his life, and turned his attention to the stock market. *He formed a theory that consisted of five moves or ”waves” upward, and three waves down. *The theory followed closely what Charles Dow had discovered nearly 50 years before, however Elliott now added the Fibonacci percentages to his analysis, allowing him to “predict” future turning points in the stock market based on the price action.
7: Candlesticks
Munehisa Homma was a very successful rice trader in Japan during the 1700s, generating over 100 billion dollars of profit in todays prices. *He formed a theory for trading and analysing the market which has become known as candlestick charting. *There are more than 20 candlestick “patterns” that evolve in the market, and many more ways to trade with them. *The main draw card for new traders and investors is the way the price is drawn, with a thick body coloured either black or white depending on which way the price closes. *As the picture shows, the bars look like candles, hence the name.
8: Highest Highs, Lowest Lows
While not so much a theory in itself, using a highest high of the last ”x” days (or weeks, months) has been used independantly by many great and successful technical analysts, especially in the areas of Trend Following and Automatic Trading Systems. *Richard Donchian pioneered one method that used four week highs and four week lows to buy and sell. *William O’Neil of Market Wizards fame also used a 52 week high signal as a part of his trading and investing, all with great success. *Using highest highs is also very easy to program and optimize for automatic trading system use.
9: Relative Strength Index (RSI)
The Relative Strength Index is an “Oscillator” that is used to measure the rate of change in price. *It compares market up days and market down days within a specified period and indexes the results between 0 and 100. *The result is, over “x” periods, how many days finished with a closing price above the previous trading day compared to how many days finished with a closing price below the previous trading day.
People who use the RSI often use 30 and 70 as triggers for “oversold” and “overbought” levels.
10: Stochastic
The Stochastic indicator is a momentum oscillator that compares the latest closing price of a security to the lowest low and highest high over a given period. *The resultant figure is called %K, and is displayed as a solid line. *Then %D which is a 3 day Simple Moving Average of %K, and often used as a slow stochastic or as a basis for crossover signals with %K.
Like the RSI, the Stochasic will oscillate between 0 and 100, and levels above 80 or below 20 are often used as “overbought” or “oversold” levels.
11: Parabolic Stop And Reverse
The Parabolic SAR is a trend following indicator that is often used to identify entry and exit points, including a stop loss and trailing stop loss as the trade unfolds. *As the parabolic SAR moves up with the price it provides the perfect trailing stop loss. *Once the stop loss is hit, the Parabolic SAR reverses and now gives a stop loss on the top side of price. *The Parabolic SAR is useful in trending markets, and often used in trend following automatic trading systems.
12: Bollinger Bands
Invented by John Bollinger in the 1970s just as computers were making their way into finance, Bollinger Bands consist of a moving average, and then a moving average above and below it (usually “x” standard deviations above and below the middle moving average).
What this does is give a “band” that price often moves within. *If price is nearing or touches the top of the band, it is considered likely to fall to be back within the band. *Likewise, price nearing or touching the bottom of the band is considered more likely to rise to be back within the confines of the band. *Bollinger Bands also act as a volatility measure, naturally widening during times of high volatility, and shrinking during times of consolidation.
Thanks to : ASXDave
:clap::clap::clap::clap::clap::clap::clap:
:clap:
NIFTY SPOT POSITIONAL ANALYSIS
Nifty Spot if trade and close above our Trading Support then,
yesssssss no prob for nifty long ...hold .... Target maybe our trading and trend resistance.....
+++++++++++++++++++++++++++++++++++++++
Today's position orders update :-
Nifty 5700 call option place Sell order at : 124.00
Banknifty 9900 Call option place Sell order at : 695.00
Yesbank 290 Call option place Sell order at : 36.00
~~~~~~~~~~~~~~~~~~~~~~~~~~~~~~~~~~~~~~~~~~
Fundamental and Technical Analysis :-
There are two popular methods people use:
1: The company price trend (through Technical Analysis)
2: The company earnings and balance sheet (through Fundamental Analysis)
Of course there are other ways to analyse a stock, such as quantified trading systems, the direction of the overall market (i.e. are we in a bull market or bear market?), moon phases or even football scores. *The reason we’ve included mainly fundamental and technical analysis is that many people start out trying to determine if the company they are buying is a solid one. *After all, if it has good earnings and a solid balance sheet, it should go up right? *Not always. *And that is why we look at the price trend as well.
All too often a company with good fundamentals can trend down, losing money for its investors. *And just as often, a company with a terrible balance sheet might rocket to the sky, making thousands for its investors. *This is why we must always test or quantify our method before using it.
Fundamental Analysis:
Looking at a company’s earnings, debt, assets and liabilities is called fundamental analysis. *Your stock broker will have this information for you to view, either online of via their broker reports.
The idea behind fundamental analysis that by buying companies with a strong balance sheet, solid earnings, and controllable debt, the share price is more likely to go up. *Buying strong companies is good in theory, but fundamental analysts must be aware that even strong companies can go down in price when other factors are involved (like a bear market, for example), and often a company’s earnings results are made public long after other investors have sold the share causing it to fall.
Technical Analysis :
Looking at a companys price history and volume is called technical analysis. *The most common way to do this is with a price chart, which shows the history in price of a company or market. *Often you can see years and decades of history for a stock in a price chart, which allows you to test your technical analysis theories to see if they work.
The idea in technical analysis is to identify patterns or tools that give you a high probability that the price will continue upwards. *Examples of this would be price crossing above a trend line, or a moving average as a signal to buy. *Practitioners of technical analsysis should be aware that nothing works 100% of the time: it merely gives you a higher probability of success.
Popular Fundamental Analysis Tools :-
Analysing a company’s balance sheet is one of the oldest and most common ways to analyse a stock market share. *Many new investors start out with this method because it makes sense. *After all, if a company is doing well financially on its balance sheet, the respective share price should go up, right? *Well, while there are often other factors involved, it is certainly a great place to start.
The likes of Benjamin Graham, Phil Fisher, Warren Buffett have all used and advocated the use of company statistics and fundamentals in their investing success. *Below are ten popular fundamental analysis tools, and what they mean. *Enjoy!
Popular Fundamental Analysis Tools :-
1: Dividend Yield And Franking Credit
The dividend yield is the amount the company has paid out as a dividend percentage over the last 12 months. *A great piece of information for people who invest for yearly income, the most common dividend yield is between 2% and 7% when a company has one.
Also in this information is the company’s franking amount. *As a company often pays tax on its earnings (at around 30%), often this amount can be offset when they distribute a dividend, by way of a franking credit. *A company with 100% franking, for example, can give you the full 30% credit against the dividend payment on your next tax return.
2: Earnings Per Share
The Earnings Per Share or EPS is how many cents the company earns per share. *For example, a company with an EPS of 120 will have earned 120 cents or $1.20 for each share in the last 12 months.
This is a good measure to see if the company is earning its way effectively. *Obviously, the higher a company’s earnings relative to its share price, the better buy it may be.
3: Earnings Per Share 1 Year Growth
It is good to see a company with solid earnings per share, but we also want our company to be growing and not going backwards.
Therefore, a company with a good EPS 1 Year Growth percentage is a good thing to look out for. *Obviously one that is growing at 50% might be a better buy than one that is growing at only 5%.
4: Cashflow Per Share
Cashflow is often used to gauge a company’s performance, and has been referred to as the life blood of any business. *Many analysts believe that it is easy to manipulate earnings per share, but much more difficult to manipulate the cash on hand. *Also, if a company does not have enough cash on hand to support its operations, it is more likely to become insolvent.
5: Cashflow 1 Year Growth
As it is important for a company to have ample cash on hand, so too it is important to see that the cashflow of a company is growing.
6: Price to Book (PB) Ratio
The Price to Book ratio is the price of the share relative to all of the company’s assets. *If the P/B ratio is less than one then it is said that the share price is less than that of its combined assets, and a candidate for good “value”. *Of course a Price to Book ratio of greater than one indicates that the market is taking into consideration other factors, like potential future earnings.
A study by a United States account found that investing with the Price to Book ratio alone (less than 1) yielded a success rate of 44% wins overall. *However the annual return on those wins was so great that it made up for all the the companies that went down and resulted in a stunning annual performance of 23% p.a. over 20 years.
7: Price to Earnings (PE) Ratio
The Price to Earnings Ratio is one of the best known financial ratios in Fundamental Analysis. *As it is the price relative to the company earnings per share, often investors will advocate that the lower the ratio the better.
For example, a company with earnings of 20 cents per share, trading at $1.00 per share, will have a ratio of (100 / 20 = 5) five. *Obviously if you could invest in a company that was making 20 cents in the dollar it would be seen as a good buy. *The average P/E Ratio over the years is around 14, and many value investors will go for a ratio of less than 10.
8: P/E Growth Ratio
The P/E Growth ratio or PEG ratio is the P/E of a share divided by its annual EPS growth. *It can be done using the current EPS growth or projected EPS growth.
For example, a company with a P/E of *11 and 39% 1 Year EPS Growth would be: 11 / 39 = 0.28. *It is said that a company with a PEG of 1 is at fair value, less than one would be considered good value, and greater than one would be considered “expensive”.
9: Interest Cover
The Interest Cover is the amount of times a company’s earnings (before interest and tax) covers the interest on their debts. *For example a company that earns 50 cents per share and pays out 5 cents per share in interest on its debts, would have an interest cover of 10.
A negative interest cover is often to be avoided when looking at shares using fundamental analysis, as it may mean that the company is not earning enough to meet its current fixed interest obligations.
10: Debt To Equity Ratio
Often displayed as a percentage, the debt to equity ratio is the percentage of debt to a company’s equity. *For example a company with a debt to equity of 38% will have just that: 38% of debt against its equity.
Obviously some debt is good and healthy, but significant debt can be toxic. *Many investors will look for amounts around 20% to 50%.
Popular Technical Analysis Tools
Technical Analysis is the act of using a share price and volume to determine places to buy and sell. *While it used to be a relatively simple style of analysis, with the invention of computers its use has increased and has become both more simple and more complex. *Simple in that we can now with some programs scan entire markets for a technical signal in under 5 minutes. *Complex, in that technical analysts have invented more complex ways to combine price and volume in order to get what they believe might be a superior result. *Most technical analysis is still, at its core, made up of price and volume.
Below we will look at *ten popular technical anlalysis tools, ranging from simple tools anyone can draw on a chart through to the more complex computerised ones. *Enjoy!
1: Trend Lines
Trend lines are very simply, a line on a chart. *On a simple bar chart a down trend line is drawn over two or more peaks. *An up trend line is drawn over 2 or more troughs. *Traders and investors will often take price crossing above a trend line as a signal to buy, or price crossing below an up trend line as a signal to sell.
The benefits of trend lines are they are very easy to draw, use and learn, and can get you into and out of trades before other methods.
2: Moving Averages
A moving average is a plot on a bar chart that shows you the average of the last “x” amount of days, weeks, months or years. *To give you an example, a 50 day moving average would be a line on your bar chart that shows the average of the last 50 days in price. *As the price moves and changes, so does the moving average.
Many traders and investors use moving averages as buy and sell signals, as support and resistance or with another moving average or combination where one crossing above another is a buy or sell signal. *Moving averages have been used as part of many automatic trading systems over the years, and can also be separated into Exponential Moving Averages (EMA) where more weight is given to the more recent data, and Simple Moving Averages (MA).
3: Support And Resistance
Price support and resistance is often used by technical analysts for good reason. *Places where large buyers buy and sell become points of support and resistance in the market due to simple laws of supply and demand (i.e. if there are large sellers at a particular price point, it will be hard for the price to rise above this point).
4: Dow’s Theory
Charles Dow’s theory from the late 1800s was three parts: First that the market moves up and down in three phases, from hope, earnings, to euphoria, then from abandonment of hope, lack of earnings, to despair. *Second is his “higher peaks and higher troughs” theory, which according to Dow constitutes a bull market. *Conversely, lower peaks and lower troughs in price would constitute a bear market. *And lastly, the Dow Industrials average and the Dow Transports average ideally make new highs at similar times. *If the Industrials average makes a new high but the Transports does not, it indicates to Dow that there is not as much demand for the goods being manufactured.
5: Fibonnacci Numbers
Leonardo Fibonacci, the Italian economist who introduced the decimal number system to Europe in the 1200s, also invented a number series that was found all throughout the universe: in nature, cells, economics, and life. *The numbers are found by adding the last two numbers in the sequence together, for example: 1, 1, 2, 3, 5, 8, 13, 21, 34, 55, 89, and so on. *Dividing a number by its predecessor (i.e. 89 / 55) gives us the “golden mean”, or 1.618. *Now (starting from 0.236 or 23.6%) multiplying onward by 1.618 this gives you a series of percentages, and Technical Analysts around the world have found that the market tends to find support and resistance in the future at and around these percentages!
6: Elliott Wave Theory
Taking Fibonacci and Dow’s Theory one step further was Ralph Elliott, an accountant who became ill and bedridden late in his life, and turned his attention to the stock market. *He formed a theory that consisted of five moves or ”waves” upward, and three waves down. *The theory followed closely what Charles Dow had discovered nearly 50 years before, however Elliott now added the Fibonacci percentages to his analysis, allowing him to “predict” future turning points in the stock market based on the price action.
7: Candlesticks
Munehisa Homma was a very successful rice trader in Japan during the 1700s, generating over 100 billion dollars of profit in todays prices. *He formed a theory for trading and analysing the market which has become known as candlestick charting. *There are more than 20 candlestick “patterns” that evolve in the market, and many more ways to trade with them. *The main draw card for new traders and investors is the way the price is drawn, with a thick body coloured either black or white depending on which way the price closes. *As the picture shows, the bars look like candles, hence the name.
8: Highest Highs, Lowest Lows
While not so much a theory in itself, using a highest high of the last ”x” days (or weeks, months) has been used independantly by many great and successful technical analysts, especially in the areas of Trend Following and Automatic Trading Systems. *Richard Donchian pioneered one method that used four week highs and four week lows to buy and sell. *William O’Neil of Market Wizards fame also used a 52 week high signal as a part of his trading and investing, all with great success. *Using highest highs is also very easy to program and optimize for automatic trading system use.
9: Relative Strength Index (RSI)
The Relative Strength Index is an “Oscillator” that is used to measure the rate of change in price. *It compares market up days and market down days within a specified period and indexes the results between 0 and 100. *The result is, over “x” periods, how many days finished with a closing price above the previous trading day compared to how many days finished with a closing price below the previous trading day.
People who use the RSI often use 30 and 70 as triggers for “oversold” and “overbought” levels.
10: Stochastic
The Stochastic indicator is a momentum oscillator that compares the latest closing price of a security to the lowest low and highest high over a given period. *The resultant figure is called %K, and is displayed as a solid line. *Then %D which is a 3 day Simple Moving Average of %K, and often used as a slow stochastic or as a basis for crossover signals with %K.
Like the RSI, the Stochasic will oscillate between 0 and 100, and levels above 80 or below 20 are often used as “overbought” or “oversold” levels.
11: Parabolic Stop And Reverse
The Parabolic SAR is a trend following indicator that is often used to identify entry and exit points, including a stop loss and trailing stop loss as the trade unfolds. *As the parabolic SAR moves up with the price it provides the perfect trailing stop loss. *Once the stop loss is hit, the Parabolic SAR reverses and now gives a stop loss on the top side of price. *The Parabolic SAR is useful in trending markets, and often used in trend following automatic trading systems.
12: Bollinger Bands
Invented by John Bollinger in the 1970s just as computers were making their way into finance, Bollinger Bands consist of a moving average, and then a moving average above and below it (usually “x” standard deviations above and below the middle moving average).
What this does is give a “band” that price often moves within. *If price is nearing or touches the top of the band, it is considered likely to fall to be back within the band. *Likewise, price nearing or touching the bottom of the band is considered more likely to rise to be back within the confines of the band. *Bollinger Bands also act as a volatility measure, naturally widening during times of high volatility, and shrinking during times of consolidation.
Thanks to : ASXDave
- Status
- Not open for further replies.
Similar threads
-
 NIFTY/ BANK NIFTY Option Trade Tool (Buy/ Sell) based on Futures / Spot Prices
- Started by allex418
- Replies: 7
-
21500 points in banknifty spot in 13 months, will this survive post charges and slippage
- Started by Utkarsh Gupta007
- Replies: 1
-

-
-