Nifty spot analysis BY Santhosh2010

Status
Not open for further replies.
Joined
Sep 1, 2010
Messages
1,806
Likes
4,330
Location
salem,tamilnadu
#51
Closed position update :-

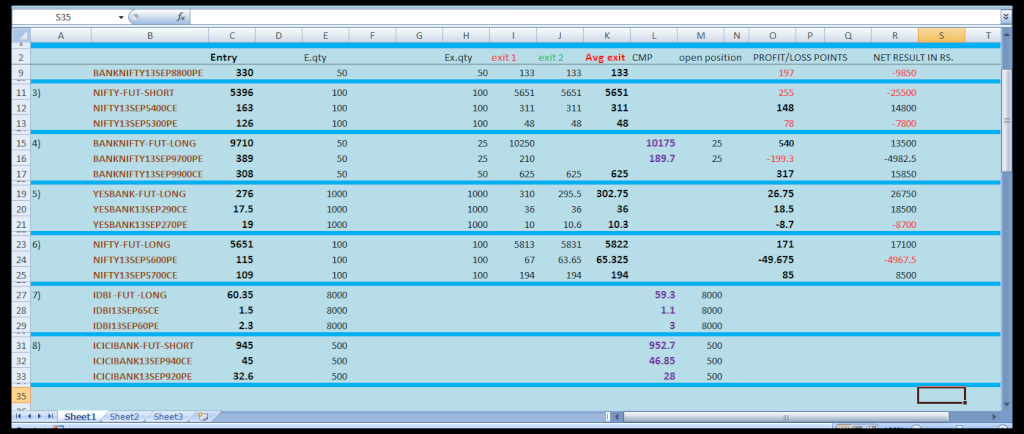
Nifty future long 1 lot(5651) - Exited (5831) = + 180 points
Nifty 5600 pe long 1 lot (115.00) - Exited (65.35) = - 49.65 points

Fresh position entry update :-

Idbi future long 2 lots (60.35)
Idbi 65 call option 2 lots (1.50)
Idbi 60 put option 2 lots (2.30)

Icicibank fut short 2 lots (945.00)
Icicibank 940 call option 2 lots (45.00)
Icicibank 920 call option 2 lots (32.60)

Open positions update :-


Download link :-

http://goo.gl/GZ5Vzx
 
Joined
Sep 1, 2010
Messages
1,806
Likes
4,330
Location
salem,tamilnadu
#52
Beready to take nifty short position : add nifty 5800ce+5700pe in your trading terminal

wait for calls update...

Update : 11.16 AM

nifty future sell below 2 lots 5835 [place sl sell order ]

once if triggered then buy 5800 ce 2 lots + 5700pe 2lots

Update : 11.40 AM


Update : 2.25 pm

buy mcdowell-n 2400pe 4 lots now cmp 30.00 stoploss 20.00 [ hold 3 days ] target 100.00 [ max loss 5000]
 
Last edited:
Joined
Sep 1, 2010
Messages
1,806
Likes
4,330
Location
salem,tamilnadu
#54
Nifty spot analysis 16/sep/2013 [vimalraj]


Pending order :-

Nifty future sell below 2 lots 5835 [place sl sell order ]
once if triggered then buy 5800 ce 2 lots + 5700pe 2lots

~~~~~~~~~~~~~~~~~~~~~~~~~~~~~~~~~~~~~~~~~~~
How To Trade The V-Bottom

V-Bottom occurs when price creates a V-shaped bottom at a support level. This is one of the least known chart patterns, but once clearly identified it can be a great entry point. It it especially good for breakout traders, as this is the only way of trading this pattern. We will start by presenting the general appearance of the pattern, teach how to trade it and finally present several examples.

Appearance

The V-Bottom is a bottom with a sharp slope and quick movement between low to high. While the Double Bottom is slow and curly, this V-Bottom is a quick pattern when price moves quickly. It can be identified by the long candles that it is built of. While other bottom patterns like the Round Bottom or Double Bottoms are slowly created, this one is created swiftly.


How To Trade
The V-Bottom is traded only in breakout. Breakout occurs when price breaks the resistance neckline, like in Figure 2.
The target for the V-Bottom is projected in this way:
The size of pattern is defined as the neckline minus the lowest low. The size of the pattern is projected after the breakout, by adding it to the price where breakout occurred. Make sure that the Risk:Reward ratio is at least 1.5 before entering.
This is a reliable chart pattern, though it is not common and hard to identify. Trade with caution, as breakouts tend to be a tricky signal to enter on.
 
Joined
Sep 1, 2010
Messages
1,806
Likes
4,330
Location
salem,tamilnadu
#55
 
Joined
Sep 1, 2010
Messages
1,806
Likes
4,330
Location
salem,tamilnadu
#56
12:00 INR Indian WPI (YoY) 5.80% 5.79%

Overview :-
The Wholesale Price Index (WPI) measures the change in the price of goods sold by wholesalers.

The higher this number is the stronger the affect on consumer inflation.
A higher than expected reading should be taken as positive/bullish for the INR, while a lower than expected reading should be taken as negative/bearish for the INR.

 
Joined
Sep 1, 2010
Messages
1,806
Likes
4,330
Location
salem,tamilnadu
#57
Icicibank fut now cmp 978.00 exited all open positions
 
Joined
Sep 1, 2010
Messages
1,806
Likes
4,330
Location
salem,tamilnadu
#58
mcdowell-n 2400pe 4 lots = sl hit
 
Joined
Sep 1, 2010
Messages
1,806
Likes
4,330
Location
salem,tamilnadu
#59
Hcltech future short 2 lots at : 1019 +
buy hcltech 1020 call option 2 lots at : 30.45 +
Buy hcltech 1000 put option 2 lots at : 22.85
 
Joined
Sep 1, 2010
Messages
1,806
Likes
4,330
Location
salem,tamilnadu
#60
 
Status
Not open for further replies.

Similar threads

Broker Special Offers