Nifty Entry ,Exit ,Target levels with Median Line Charts

Status
Not open for further replies.

Kavima

Well-Known Member
#64
27.09.2011 Hourly chart update
The gap open was a surprise, but with the global markets moves,was probably a possibility.The resistance expected at 4920 was broken on the upside after the first 2 hours and no looking back...
My expectation was a steady rise towards the resistance levels and price bars to show a negative turn which did not happen so did not enter any short trade.Will watch out for resistances at higher levels at 5000-35 range , the next resistance band for any negative cues.


Kavima

Well-Known Member
#65
28.09.2011 hour chart update

Minor pullback from Median line.The 5000-5030 range is going to be major test , as to whether nifty will breakdown or move northwards.As we have made a higher Low , the upward move is also a probability if it crosses 5030.There should be some consolidation with some zig zag movements around the Longterm downsloping Pitchfork .( shown in earlier chart)
 

Kavima

Well-Known Member
#66
29.09.2011_hour chart update

Price made an early low and climbed upto the zone till 5035 where I expected the resistance ie the point where the Upward Green Median line and downward red Upper median line intersects.
The pullback was contained within 38.2 %R of the previous swing and today making a higher high than the prev high, makes me consider the probability of an upmove developing.,The swing is heading towards prev high at 5150 zone , either immediately or with another pullback to 4987-4942 support .If it stops at 4987 and move north its going to be a swift move.Or else 1-2 days of consolidation till 4942 levels and move up.Below 4942 however this view gets negated and we're in for the move down.
Plan would be to look for support pattern at 4987-4942 zone to buy for target of 5150 zone. with stoploss of 25-30 pts.Below 4906 , price should go below the previous low of 4759.
 

Kavima

Well-Known Member
#67
30.09.2011_Friday

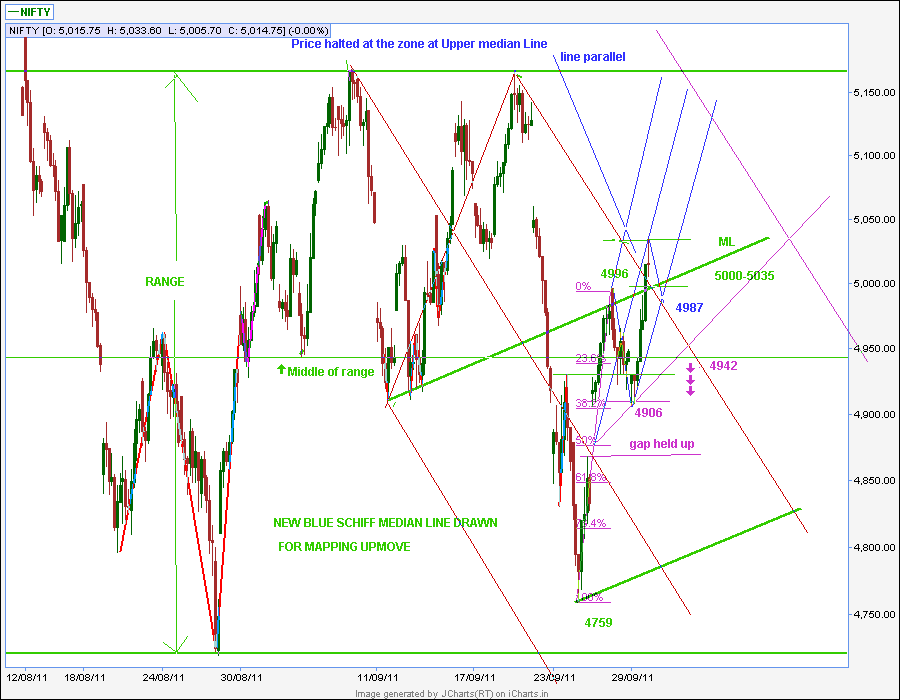
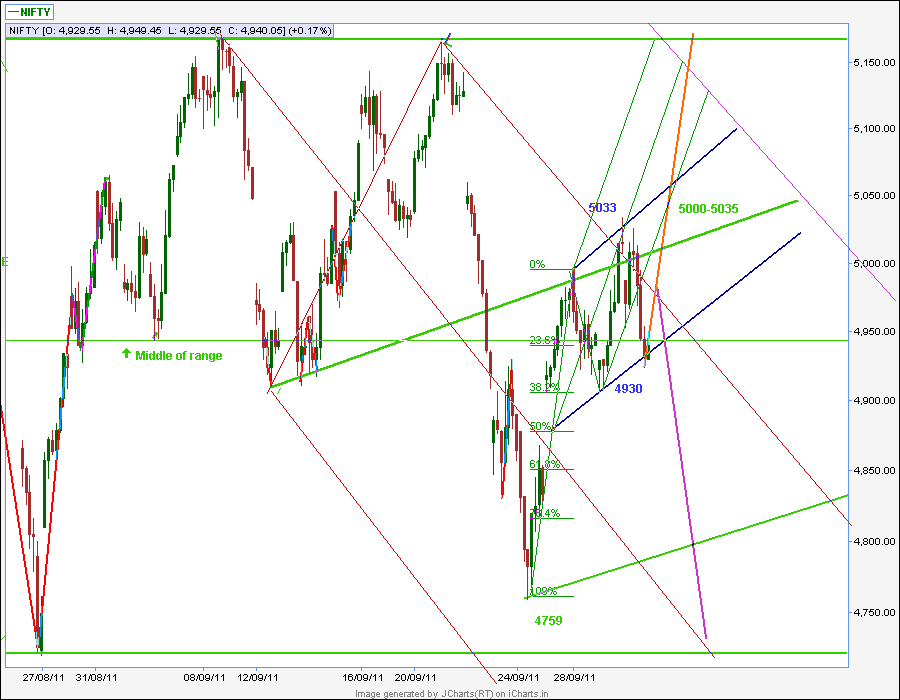
Price opened lower than yesterday's close,tested the previous high near to 5033 levels and then dropped down to close at 4940, close to our expected levels.As of now, the price is within supporting levels of a trendline channel shown in blue and the triggerline drawn from schiff median line starting pivot (50 % of previous swing.)
So the options of the swing move look 30:70 now for a move up / down.
My reasons for the possible move up are
Price moves indicate the tussle between bulls and bears for the past two-three days.The previous minor swing high has been crossed and the pullback was supported at his level.ie resistance becomes support.Today the low is still higher than yesterday's low.The prices seem to have completed a correction with an ABC pattern within a trendline channel.( though still today's low bar is not confirmed as the swing low.we'll wait to see monday's action)
IF the prices hold at this level, then the move can happen upward.But price has to be really strong as the climb beyond the resistance at 5033 is more than the down side support breakdown level at 4930.( 5033-4940=93 points against 4940-4930=10 points).The global cues are also so negative the negative outlook has more probability.
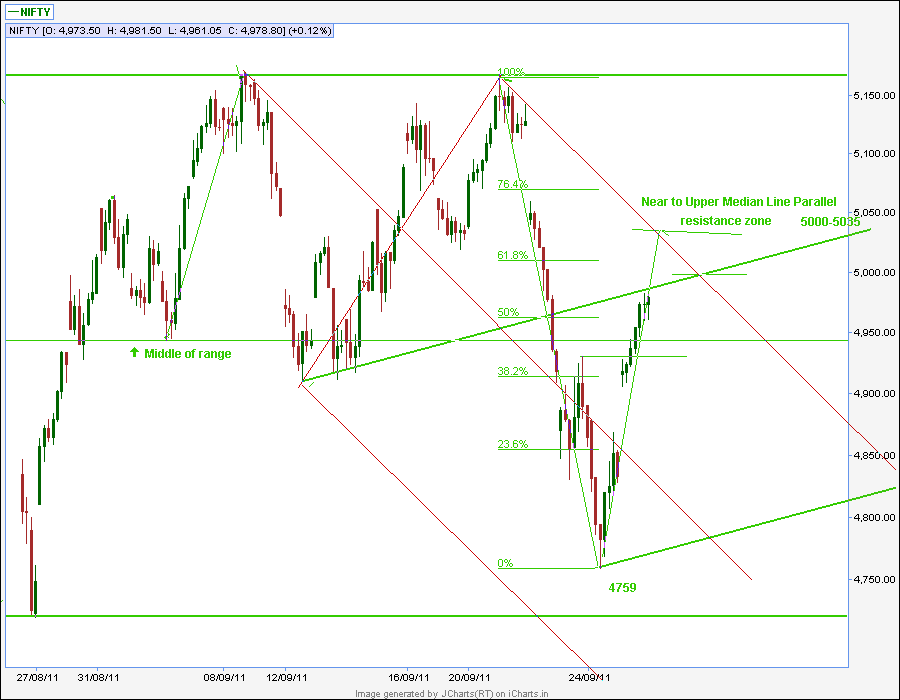
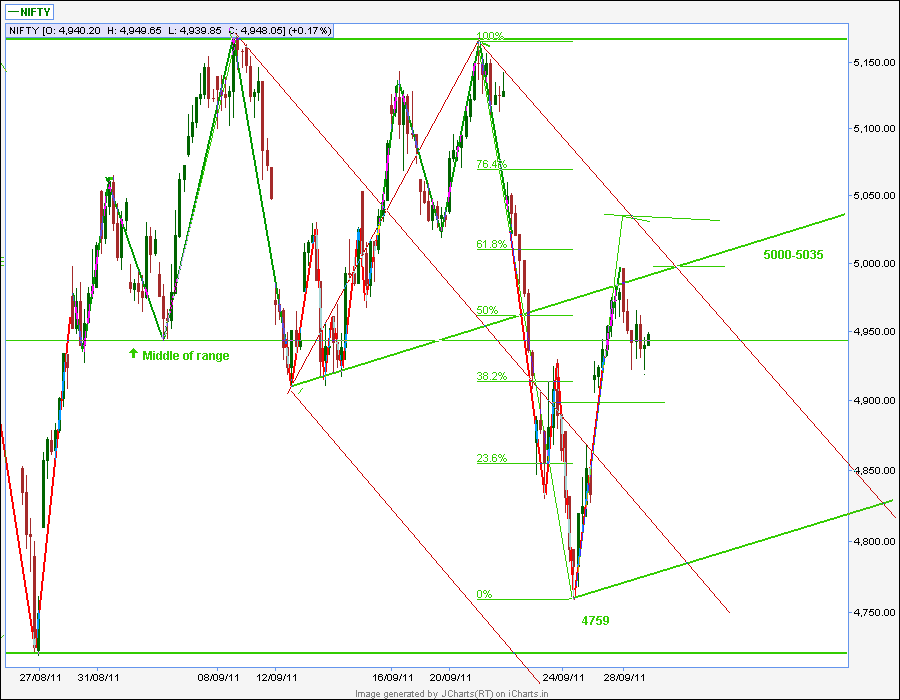
Price is exactly near the middle of the range of the past one month and it is going to be tough call for trade decision on Monday till the trend emerges.
 
#68
hi kavimaji,

Can u post the lines for DLF & Tatamotors.I have bought puts of 220pe and 156pe respectively.i am not sure whether DLF will be down to 200 and TataMotors @ 148-150.

Thanks in Advance.:)
 

Kavima

Well-Known Member
#69
hi tuks87

I'll give the dlf chart below with my analysis.
Uploaded with ImageShack.us
IMO - Currently the price has fallen from a double top at the Blue Upper median Line resistance.It is yet not crossed 23.6% zone of the prev swing so the downmove not confirmed yet.However it may retest 222-223 before falling down to 212-208 near to Blue Median line marked.This corresponds to 38.2 % R of the prev swing and 208 level to 50 % R which is also a horizontal line connecting previous swing tops which can act as support level.There should be some consolidation at this levelIf this level does not hold , the price can fall down to 200 levels.
 
Status
Not open for further replies.