What a day!!
The fall expected has come a few days later , and the intensity was so fierce and raced downwards to ultimately stop near 4900 levels.
22.09.2011 _Hourly chart Update
What do my median Lines indicate for the next moves.Obviously the down move is going to extend further but worked on the probabilities of the pattern in which this downmove may unfold.
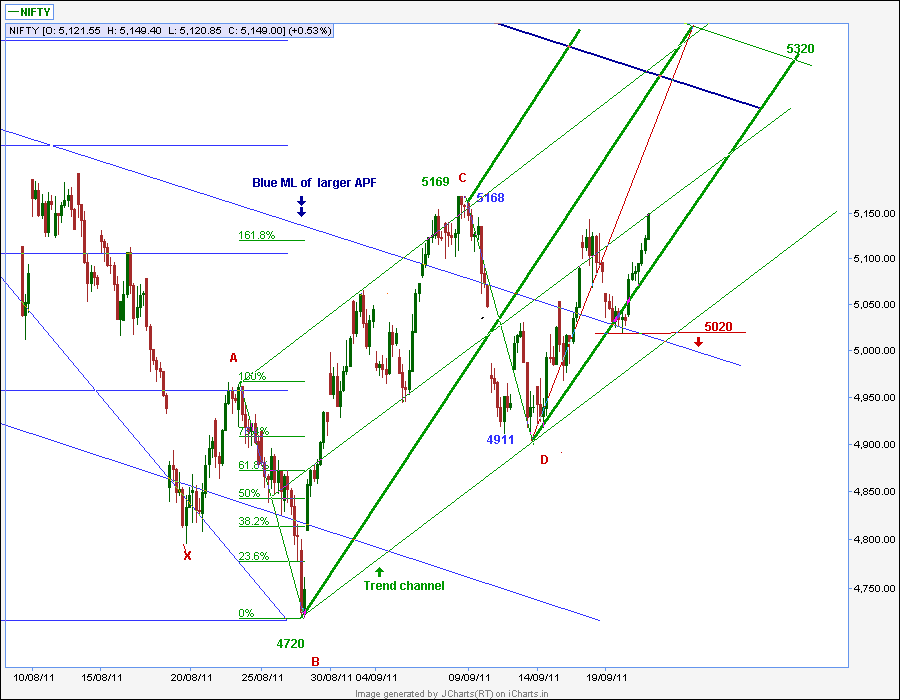
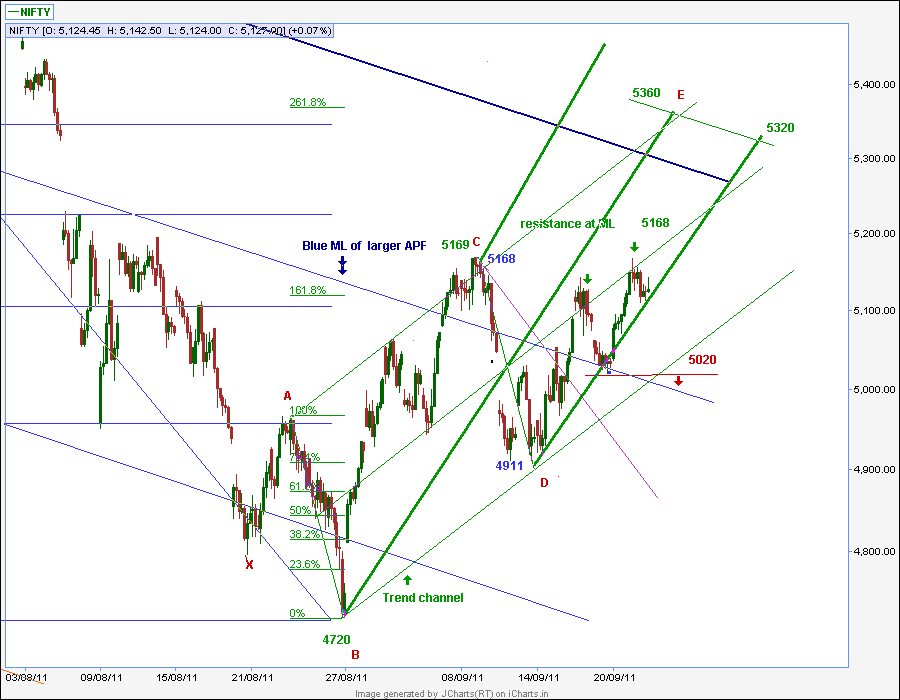
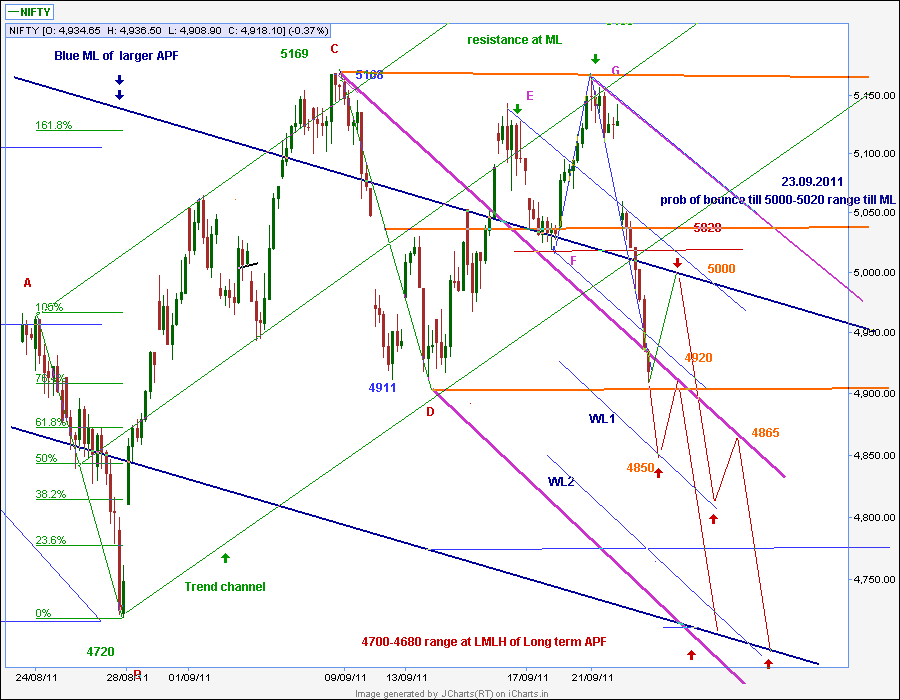
Referring my chart, marked the important pivots as A,B,C,D,E,F,G till the recent height at 5168.
after the gap down, first blue downsloping pitchfork was drawn.Price bar has moved past the LMLH of the blue median line.Going to the next higher swing pitchfork, the magenta downsloping Pitchfork is drawn.Here the price bar has met the magenta ML and paused today.
What next?
Probabilities...
1.Median lines are possible support points .So after the deep fall, a minor bounce can happen.If so it can reach upto 5000-5020 levels.From there , the price can go down towards 4700-4680 range.
2.Price gaps down on Friday, reaches the Warning line parallel of the blue APF at say 4850 levels, bounce till 4900 and fall down further towards 4700-4680 .
I work out my levels as round numbers only around the parallel lines of the pitchfork and finetune based on chart patterns around them as the prices unfold.Fibonacci numbers for swings are also projected and when they match the median line levels, it is a double confirmation like other systems where 2-3 indicators are used to confirm signals.