Re: 1 lakh to 652 lakhs in 497 trading days - Winning 20% of Trade in NIFTY Futures -
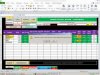
Choose Currency as the Index and try with Code USDINR. Then if you click on the "Update Pivots" button you will see the Pivot chart for USDINR. do not Try the "Refresh" button for stocks other than NSE listed in NSE FandO.
Normally we follow HANGSENG in the morning. So just to understand the HANGSENG index, you can try the index as INDEXHANGSENG and code as HSI.
Similarly for other indices like NIKKEI, FTSE, NASDAQ, DOWJONES. All these data is downloaded from the Google Finance and Each indice work in different time zone with different start time and end time which need to be configured in the sheet called "Indices".
Always use the timeframe in multiples of 5. The minimum is 5. The max I have tried and working is 120 (2 hours). If you don't get the pivot chart properly then try a smaller frame. If it does not display properly then that means there is not enough data/pivots to display
Note : For the Currency, right now do not try any timeframe more than 5. There seems to be some issue with the data
How to use Index Column Like currency
Normally we follow HANGSENG in the morning. So just to understand the HANGSENG index, you can try the index as INDEXHANGSENG and code as HSI.
Similarly for other indices like NIKKEI, FTSE, NASDAQ, DOWJONES. All these data is downloaded from the Google Finance and Each indice work in different time zone with different start time and end time which need to be configured in the sheet called "Indices".
Always use the timeframe in multiples of 5. The minimum is 5. The max I have tried and working is 120 (2 hours). If you don't get the pivot chart properly then try a smaller frame. If it does not display properly then that means there is not enough data/pivots to display
Note : For the Currency, right now do not try any timeframe more than 5. There seems to be some issue with the data
Last edited:
")