


Trix Tricks
- Thread starter karthikmarar
- Start date
Hi Friends
More Observations on the TRIX Indicator.
TRIX is a Triple smoothed moving average of the difference in price. The MACD is the difference between two moving averages, a short one and a long one. Both these indicator are based on moving averages. Both oscillate around a zero line. Now an interesting question.. how would the behavior of these two indicator compare ?
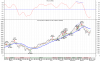
Plot the MACD and TRIX on the same chart, preferably in the same window. Use different scales for both as the range of the indicator values differ. The result is will be quite surprising. They are almost identical. It is almost as if one indicator could replace the other. Just look at the enclosed chart of the Nifty Junior. However a more careful look would bring out some differences. The peaks and troughs of the TRIX are more pronounce compared to the MACD. Another important difference is that TRIX brings out Divergences more clearly. If you look at the enclosed chart the bullish divergence in April was shown by TRIX when MACD failed to show it clearly.
Let us now look at the TRIX and the MACD Histogram. According to Dr. Alexander Elder the MACD Histogram is one of best tools available to the Technician. It also forms a part of his famous Triple screen Trading system.
MACD histogram is nothing but the difference between the MACD line and the signal line plotted as a Histogram. Now Let us plot the Histograms of TRIX and a signal line. I plotted the Histograms of MACD and TRIX ( I used a signal line of 3 day moving average of the TRIX). You can see the result yourself in the enclosed chart. Amazing isnt it!
The look so identical like twins. So all the trading rules of MACD Histogram would be applicable to TRIX Histograms also.
The Trading rules can be listed as follows
Warm regards
karthik
More Observations on the TRIX Indicator.
TRIX is a Triple smoothed moving average of the difference in price. The MACD is the difference between two moving averages, a short one and a long one. Both these indicator are based on moving averages. Both oscillate around a zero line. Now an interesting question.. how would the behavior of these two indicator compare ?
Plot the MACD and TRIX on the same chart, preferably in the same window. Use different scales for both as the range of the indicator values differ. The result is will be quite surprising. They are almost identical. It is almost as if one indicator could replace the other. Just look at the enclosed chart of the Nifty Junior. However a more careful look would bring out some differences. The peaks and troughs of the TRIX are more pronounce compared to the MACD. Another important difference is that TRIX brings out Divergences more clearly. If you look at the enclosed chart the bullish divergence in April was shown by TRIX when MACD failed to show it clearly.
Let us now look at the TRIX and the MACD Histogram. According to Dr. Alexander Elder the MACD Histogram is one of best tools available to the Technician. It also forms a part of his famous Triple screen Trading system.
MACD histogram is nothing but the difference between the MACD line and the signal line plotted as a Histogram. Now Let us plot the Histograms of TRIX and a signal line. I plotted the Histograms of MACD and TRIX ( I used a signal line of 3 day moving average of the TRIX). You can see the result yourself in the enclosed chart. Amazing isnt it!
The look so identical like twins. So all the trading rules of MACD Histogram would be applicable to TRIX Histograms also.
The Trading rules can be listed as follows
- 1.The slope of the Histogram is more important. Upwards slope indicates bullishness and Downwards slope indicates bearishness. Buy when the Histogram stops falling and starts moving up again. Sell when the Histogram stops rising and starts moving down. Of course in the daily charts the up and downs of the Histogram are numerous. The Histogram on the weekly charts provides good buying opportunities.
- 2.The second important signal from the Histogram is divergence. The occurrences are rare but they provide very sound trading opportunities. By way the TRIX by itself provides good divergence signals.
Warm regards
karthik
Last edited:
karthikmarar said:
Hi Friends
More Observations on the TRIX Indicator.
TRIX is a Triple smoothed moving average of the difference in price. The MACD is the difference between two moving averages, a short one and a long one. Both these indicator are based on moving averages. Both oscillate around a zero line. Now an interesting question.. how would the behavior of these two indicator compare ?
Plot the MACD and TRIX on the same chart, preferably in the same window. Use different scales for both as the range of the indicator values differ. The result is will be quite surprising. They are almost identical. It is almost as if one indicator could replace the other. Just look at the enclosed chart of the Nifty Junior. However a more careful look would bring out some differences. The peaks and troughs of the TRIX are more pronounce compared to the MACD. Another important difference is that TRIX brings out Divergences more clearly. If you look at the enclosed chart the bullish divergence in April was shown by TRIX when MACD failed to show it clearly.
Let us now look at the TRIX and the MACD Histogram. According to Dr. Alexander Elder the MACD Histogram is one of best tools available to the Technician. It also forms a part of his famous Triple screen Trading system.
MACD histogram is nothing but the difference between the MACD line and the signal line plotted as a Histogram. Now Let us plot the Histograms of TRIX and a signal line. I plotted the Histograms of MACD and TRIX ( I used a signal line of 3 day moving average of the TRIX). You can see the result yourself in the enclosed chart. Amazing isn’t it!
The look so identical like twins. So all the trading rules of MACD Histogram would be applicable to TRIX Histograms also.
The Trading rules can be listed as follows
Warm regards
karthik
More Observations on the TRIX Indicator.
TRIX is a Triple smoothed moving average of the difference in price. The MACD is the difference between two moving averages, a short one and a long one. Both these indicator are based on moving averages. Both oscillate around a zero line. Now an interesting question.. how would the behavior of these two indicator compare ?
Plot the MACD and TRIX on the same chart, preferably in the same window. Use different scales for both as the range of the indicator values differ. The result is will be quite surprising. They are almost identical. It is almost as if one indicator could replace the other. Just look at the enclosed chart of the Nifty Junior. However a more careful look would bring out some differences. The peaks and troughs of the TRIX are more pronounce compared to the MACD. Another important difference is that TRIX brings out Divergences more clearly. If you look at the enclosed chart the bullish divergence in April was shown by TRIX when MACD failed to show it clearly.
Let us now look at the TRIX and the MACD Histogram. According to Dr. Alexander Elder the MACD Histogram is one of best tools available to the Technician. It also forms a part of his famous Triple screen Trading system.
MACD histogram is nothing but the difference between the MACD line and the signal line plotted as a Histogram. Now Let us plot the Histograms of TRIX and a signal line. I plotted the Histograms of MACD and TRIX ( I used a signal line of 3 day moving average of the TRIX). You can see the result yourself in the enclosed chart. Amazing isn’t it!
The look so identical like twins. So all the trading rules of MACD Histogram would be applicable to TRIX Histograms also.
The Trading rules can be listed as follows
- 1.The slope of the Histogram is more important. Upwards slope indicates bullishness and Downwards slope indicates bearishness. Buy when the Histogram stops falling and starts moving up again. Sell when the Histogram stops rising and starts moving down. Of course in the daily charts the up and downs of the Histogram are numerous. The Histogram on the weekly charts provides good buying opportunities.
- 2.The second important signal from the Histogram is divergence. The occurrences are rare but they provide very sound trading opportunities. By way the TRIX by itself provides good divergence signals.
Warm regards
karthik
http://www.traderji.com/technical-analysis/21-a-moving-average-trading-system.html
In software-ADVANCED GET thread
http://www.traderji.com/advanced-get/3521-advance-get-6.html
6-4dma i.e. 6dma delayed by 4days, is said to be profitable. 6-4dma or 13dma or 13-4dma are all trend following methods and ensure good entry and exit points.
I attach hdfc.doc file with 13-4dma buy and sell expert signals.
I feel like following this system.
request your comments on this.
regards
Last edited:
Hi Sirasangi
The moving average cross over system is one of the simplest and reliable systems. The chart enclosed by you also shows reasonably good entry points. However just using only the 13 day MA normally would lead to whipsaws especially when the market is ranging. That is why a longer moving average for example 39 could be added to the system. Enter only if the longer moving average is also rising. Of course this has its own drawback in delayed entry points. The choice of moving average varies person to person. The 3-13-39 system very nicely explained by traderji , works quite fine. In my opinion newcomers would do quite well with a simple moving systems for positional trading
Like I said before if the stock is trending the moving cross over system works fine. When the market is ranging ( say moving sideways) then the same system will simply whipsaw you in and out. For example refer the period between July second week to September first week, the stock is moving sideways and you would be in and out. The same in February and march.
So what do we do? First check if the stock is trending or ranging. One of the indicators you can use to find this is the directional movement system of the ADX. Other people use the chart of higher period to confirm the longer trend. For example you can use the weekly chart to confirm the trend.
Your system is nice, but do try to add trend confirmation to improve your system.
Best regards
karthik
Hi Karthik,
I am just back from a short trip to india. I was just going through your posts regarding the TRIX.
I was just curious enough to apply the same on NIFTY (TRIX - 9 day). While the TRIX was showing a Bearish engulfing pattern, NIFTY was going up and up ( i am attaching a chart in support of this). Finally NIFTY had to fall in confirmation of the TRIX.
Please let me know, If my analysis is right. Please correct me if I am wrong.
Satya
Attachments
-
 27.1 KB Views: 358
| Thread starter | Similar threads | Forum | Replies | Date |
|---|---|---|---|---|
|
|
Matrix - Index of God | Algo & Automated Trading | 1 | |
|
|
AFL for Trix on amibroker | AmiBroker | 1 | |
| P | Alphametrix renko file | MetaTrader | 8 | |
| K | Anyone uses ALPHAMETRIX MT4 Software? | Software | 5 | |
| B | _automatictrendlinesTRIX | AmiBroker | 1 |