They are right IMO. I will explain later..
Is the trendline drawn correctly now ??
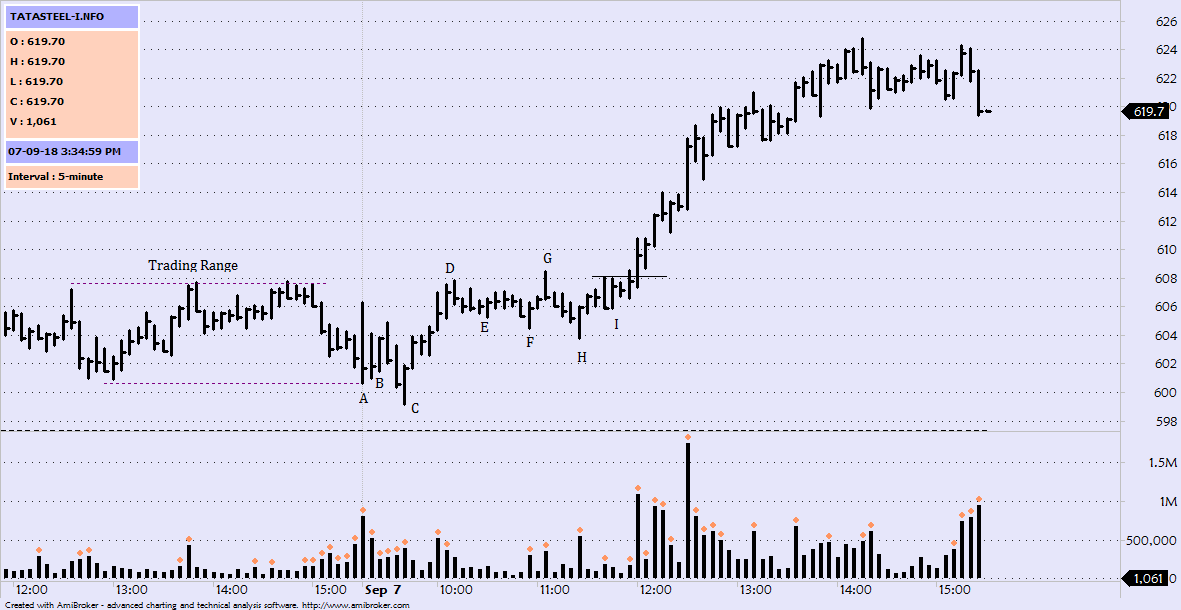
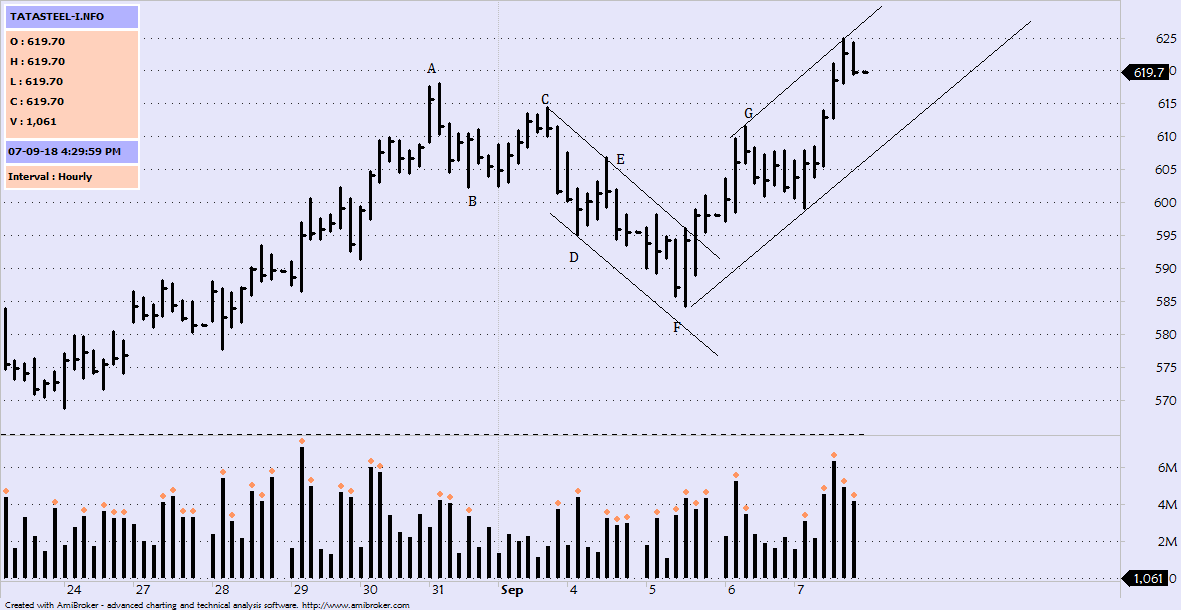
In the morning I had connected A (The peak) and C (1st lower swing low) and extended. The recent upmove from F faced resistance near that extended line so I drew a parallel line near F and made it a downtrend channel. I guess that was wrong.
Now about buying climax on hourly. I had marked the bar just before G as a buying climax. As per the definition on what I have read - "A high to ultra high volume up bar closing in the middle and into new fresh high ground is a buying climax". And there should be upmove behind you.
Now near F demand clearly overcame supply and a strong rally led price from F to G. AT the bar prior to G price crossed the resistance above E (supply from nearest swing high and a new ground), but closed off the high. The volume was ultrahigh, The highest among last 3 sessions. So I marked that as buying climax.
Now for bag holding on 5m chart -
Again as per the definition - "A narrow spread down bar with ultra high volume. and It should be into fresh new low ground. A point is reached when the herd panic and unload their holdings at rock bottom prices. "
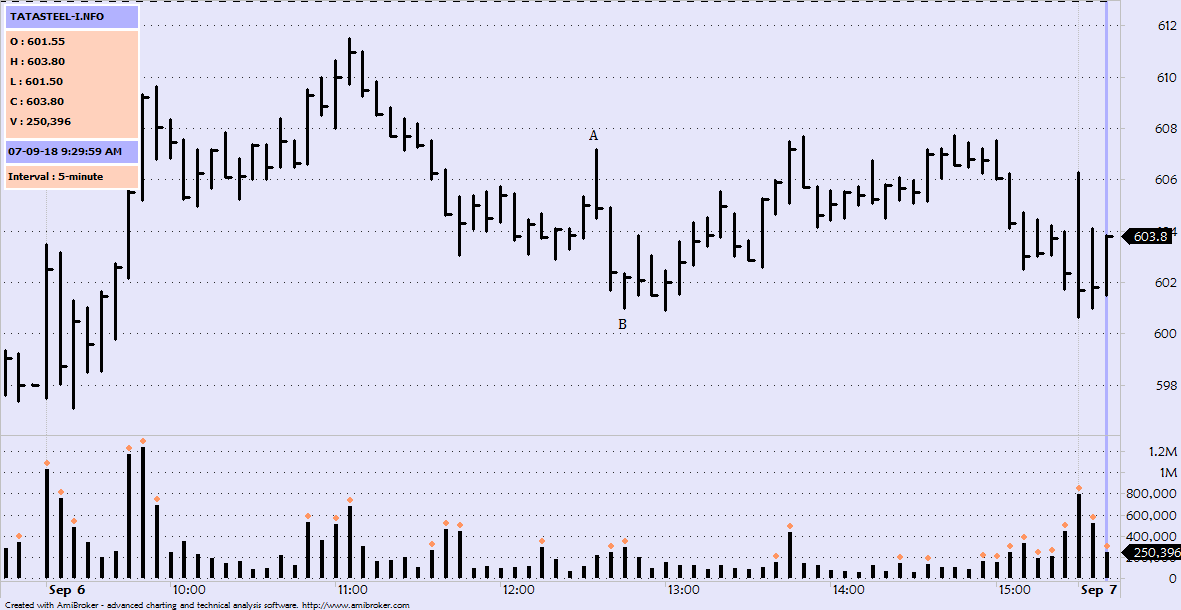
From A to B there is sharp selling leading price below the recent congestion low. The bar before B indicates effort to fall, below which there could be panic selling. But then it formed a narrow spread, high close down bar on high volume"
Please correct what wrong do you see here..