


Teach A Man To Fish And.........
- Thread starter Saint
- Start date
- Status
- Not open for further replies.
Friends,
just to share info.
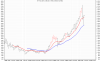
I am attaching the Chart of Nifty (Monthly) here. It looks very intersting but not sure how much relevant it is.
The last but 1 Bar if considered as Kangaroo Tail (I am not sure of Kangaroo tail releavance in a monthly chart) then the next bar is almost at the Top of the Bar.
So, we can see considerably upside in the NIFTY in the coming weeks or months.
Please do add your comments...
Satya
just to share info.
I am attaching the Chart of Nifty (Monthly) here. It looks very intersting but not sure how much relevant it is.
The last but 1 Bar if considered as Kangaroo Tail (I am not sure of Kangaroo tail releavance in a monthly chart) then the next bar is almost at the Top of the Bar.
So, we can see considerably upside in the NIFTY in the coming weeks or months.
Please do add your comments...
Satya
Attachments
-
 17.5 KB Views: 776
Saint said:
Hi Gobatman,
Always best to let the weekly and daily confirm each other before an entry.Our objective is to grab the meat out of the trend.So,let the daily rally,stay out of it,then let it pullback,and then if we form a higher pivot low on the weekly,grab it.Yes,you would miss out on the first rally........you would also lose some profits at the top.But there is lots of money to be made from the meat in between....and lots of restful sleep at nights knowing that the charts do not conflict with one another.
All the best!
Saint
Thanks a lot for your reply! Will follow this method.
Regards,
Amit
TRENDS
PRIMARY TRENDS :
The Primary Trends are what we in common parlance state as "Bull market" or "Bear Market".Just as a Secular Uptrend is made up of several primary uptrends and downtrends,the Primary Uptrend is made up of several intermediate uptrends and downtrends.Vice versa for the Primary Downtrend.
As we had discussed before,a Primary Uptrend is of greater magnitude and duration if in the broader picture,we are also in a Secular Uptrend.A Primary Dntrend would be of shorter magnitude and duration if it happens in a Secular Uptrend.
So too,in a Secular Downtrend,the Primary Dntrends are of greater magnitude and duration as compared to the Primary Uptrends.
Just take a look at the two charts of the Nikkei and Sensex in the previous page to get things clear.
A Primary Trend lasts anywhere between 9mths and 2 1/2 yrs.
INTERMEDIATE TRENDS :
So too, an intermediate uptrend is made up of several short term trends.Again,if we are in a Primary Uptrend,the Intermediate Uptrends are of greater magnitude and duration as compared to the Intermediate Dntrends.
Vice versa in a Primary Dntrend.
An intermediate trend can last anywhere between 6weeks to 9mths.
More for later,after some Caffeine!!
Saint
Dear Saint,
How are you? So are u back in India now or still settled in Singapore. I have a friend who recently moved to singapore and is working with UBS. So what do u do there? Sorry if you do not want to answer personal question just want to know more about the people on the forum. I am thinking of starting a thread where everyone can write about themselves. Would be nice to know about all masked friends")
Ok back to technicals. I am slowly trying and learning how to fish. I have bought myself a fishing rod now. Got metastock. Well friend loaded on my computer. But I promise to get an orignal one once I am more comfortable with it.
I had a few questions to help me put worms on my hook.
1) How do we change from arithmetic to logirmethic scale.
2) When I open a chart on the metastock it shows a stock from 2004
onwards. How can i change the period of the charts.
3) How do we use histograms on MACD. I mean I want to plot The difference
between the MACD and signal line. And also It gives me the option to
change the time period for the signal line( which is 9). But i am not able to
change the time period of the two moving averages used to plot MACD.
4) can you guide me what time periods should I use for the three simple
indicators( RSI, MACD, Stochastics). Right now I am using 14 days for
RSI. Stochastics 5 and 3. Signal line 9 and I am not sure what period it is
using for the plotting the MACD. And should we us different time periods
for daily charts, for weekly charts and for monthly charts. Also do they
change if market is volatile. If yes could pls briefly note them down for me.
I know these are too many questions but would help to get a start with my software.
Rgds
Rahul
How are you? So are u back in India now or still settled in Singapore. I have a friend who recently moved to singapore and is working with UBS. So what do u do there? Sorry if you do not want to answer personal question just want to know more about the people on the forum. I am thinking of starting a thread where everyone can write about themselves. Would be nice to know about all masked friends
Ok back to technicals. I am slowly trying and learning how to fish. I have bought myself a fishing rod now. Got metastock. Well friend loaded on my computer. But I promise to get an orignal one once I am more comfortable with it.
I had a few questions to help me put worms on my hook.
1) How do we change from arithmetic to logirmethic scale.
2) When I open a chart on the metastock it shows a stock from 2004
onwards. How can i change the period of the charts.
3) How do we use histograms on MACD. I mean I want to plot The difference
between the MACD and signal line. And also It gives me the option to
change the time period for the signal line( which is 9). But i am not able to
change the time period of the two moving averages used to plot MACD.
4) can you guide me what time periods should I use for the three simple
indicators( RSI, MACD, Stochastics). Right now I am using 14 days for
RSI. Stochastics 5 and 3. Signal line 9 and I am not sure what period it is
using for the plotting the MACD. And should we us different time periods
for daily charts, for weekly charts and for monthly charts. Also do they
change if market is volatile. If yes could pls briefly note them down for me.
I know these are too many questions but would help to get a start with my software.
Rgds
Rahul
Originally Posted by Anupama Singh
Hello Saint!
At what stage in a intermediate downtrend do we say that we are in a bear market?
How do we make out the difference between a major trend move and an intermediate trend move?
Please take your time in answering,maybe over the weekend.
Thanks!
Regards!
Anu
Hello Saint!
At what stage in a intermediate downtrend do we say that we are in a bear market?
How do we make out the difference between a major trend move and an intermediate trend move?
Please take your time in answering,maybe over the weekend.
Thanks!
Regards!
Anu
Okay in continuation..........we now know what a secular,primary trends and intermed trends are.We know that each larger time frame has within it smaller time frames of trends.Now,to your question.........we have an intermed uptrend,followed by an intermed downtrend,followed by an intermed uptrend,so on so forth.
Few rules:
1)After an intermediate uptrend,the correction should be only 33-66% of that cycle(One intermed cycle=one intermed uptrend and one intermed dntrend).
--Greater the retracement,the increased likelihood that the primary trend has reversed to the down.
2)Substantial increase in volume during the price decline
The above are the basics......if you are playing with indicators as well,then all the negative divergences,moving avg crossovers puts you on Caution Mode.
Have a look at the chart below.......please do ask if anything is not clear.
Gotta Run........World Cup Mode..
All the best!
Saint
Last edited:
srisara said:
Friends,
just to share info.
I am attaching the Chart of Nifty (Monthly) here. It looks very intersting but not sure how much relevant it is.
The last but 1 Bar if considered as Kangaroo Tail (I am not sure of Kangaroo tail releavance in a monthly chart) then the next bar is almost at the Top of the Bar.
So, we can see considerably upside in the NIFTY in the coming weeks or months.
Please do add your comments...
Satya
Besides, kangaroo tails in monthly charts should not be used as a guiding tool in my opinion. The basic premise of kangaroo tail is that market makers earn not on account of price changes but trading volume. Hnece, if they find very low volume on extreme prices, they will bring up/down the price to generate more trading volumes. Thus, it can be dubbed a bit of manipulative move by the market maker.
As this theory can't be applied to monthly charts, the premise is lost and thus there is no pattern at all least to talk about the effect of the pattern.
Best Regards,
--Ashish
Saint said:
Great stuff,Agilent......agreed.
As it stands now,this dntrend is nothing but an intermediate dntrend.If this rally has legs and we go on to make new highs,that confirms that.If on the other hand,if this rally is unable to go to new highs thereby forming a lower pivot high,we are in danger of a primary dntrend(bear market).A lower pivot high is only a danger of a possible bear.Confirmation of the bear market comes if the fall takes out the lows of 8799.
Saint
Good to see you back. I do hope you are right about the intermediate dntrend. With all the divergence in ROC and TRIX in the monthly charts of nifty, I hope we dont go into a primary bear trend..
. Enclosing the monthly chart. Would like to know your views...regards
Karthik
Last edited:
Saint said:
The above are the basics......if you are playing with indicators as well,then all the negative divergences,moving avg crossovers puts you on Caution Mode.
Have a look at the chart below.......please do ask if anything is not clear.
Gotta Run........World Cup Mode..
All the best!
Saint
Have a look at the chart below.......please do ask if anything is not clear.
Gotta Run........World Cup Mode..
All the best!
Saint
karthikmarar said:
Saint
Good to see you back. I do hope you are right about the intermediate dntrend. With all the divergence in ROC and TRIX in the monthly charts of nifty, I hope we dont go into a primary bear trend.. . Enclosing the monthly chart. Would like to know your views...
regards
Karthik
Good to see you back. I do hope you are right about the intermediate dntrend. With all the divergence in ROC and TRIX in the monthly charts of nifty, I hope we dont go into a primary bear trend..
. Enclosing the monthly chart. Would like to know your views...regards
Karthik
Just have a look at the chart above.....says everything.
Basically,this correction from the May top is too deep to be wished away as yet another intermediate dntrend.Calling it a primary downtrend as markets plunged on May22 is being a bit premature.An intermediate dntrend is one till it isn't.But the next wave drop to June 14th lows takes it down to more than 80% correction of the previous intermed cycle.
My personal opinion is that this no more looks like an intermediate dntrend in a primary uptrend.I feel we are starting off the first leg of a Primary Dntrend.We are still very much in a Secular Bull Market though..........
But as always,we can confirm that only once the market drops below 2595.We are at that spot of bother on the charts where the bullish orientated trader sees things going to new highs,and the bearish ones seeing new lows.It would be wrong to say that this IS a Primary Dntrend for sure till confirmation.To say that this is nothing but an intermed dntrend would be dangerous and wrong.........that statement in red should be modified to "This dntrend is nothing but an intermediate dntrend till we get a confirmation that this is a primary dntrend.But the depth of this retracement is giving rise to the possibility that it's looking more and more like the first leg of a Primary Dntrend"
And yes agreed on the indicators bit as well.
All the best!
Saint
- Status
- Not open for further replies.
| Thread starter | Similar threads | Forum | Replies | Date |
|---|---|---|---|---|
| A | Teach a Man to Fish – "Rise of Machines" version | Advanced Trading Strategies | 101 | |
| G | charts in Teach A Man To Fish And | Technical Analysis | 1 | |
|
|
Teach a man to fish compilation(pdf) | Technical Analysis | 24 | |
| N | Teach A Man To Fish | Technical Analysis | 7 | |
| D | Help for teach a man to fish | Technical Analysis | 5 |
Similar threads
-
Teach a Man to Fish – "Rise of Machines" version
- Started by ag_fx
- Replies: 101
-
-

-
-