


This great Trading System is designed by greatest BD Coder MRTQ13 who is the pioneer of TA in Bangladesh. Actually I am not a cooder but just sharing his invention to all as he has no objection to do so. Definitely it will help all TA. This system is called Nirvana. the circle band shows you all signal for buy/hold/sell. Hope u will enjoy. Hats off to MRTQ13, who inspired me to follow TA technique.
_SECTION_BEGIN("Forex_Main_mrtq13");
///////////////////////////////////
Title =
EncodeColor(colorWhite)+ Title = Name () + " | "
+EncodeColor(colorYellow) + Date() + " | "
+EncodeColor(colorTurquoise)+ "O : "+ EncodeColor(colorLightGrey)+ O + " | "
+EncodeColor(colorTurquoise)+ "H : "+ EncodeColor(colorLightGrey)+ H + " | "
+EncodeColor(colorTurquoise)+ "L : "+ EncodeColor(colorLightGrey)+ L + " | "
+EncodeColor(colorTurquoise)+ "C : "+ WriteIf(C> Ref(C, -1),EncodeColor(colorBrightGreen),EncodeColor(colorRed))+ C + " | "
+EncodeColor(colorTurquoise)+ "Change : ("+ WriteIf(C> Ref(C, -1),EncodeColor(colorBrightGreen),EncodeColor(colorRed)) + WriteVal(C-Ref(C,-1))+" Tk."
+EncodeColor(colorTurquoise)+ " /"+ WriteIf(C> Ref(C, -1),EncodeColor(colorBrightGreen),EncodeColor(colorRed))+ WriteVal( ROC( C, 1 ))+""+ " % "
+EncodeColor(colorTurquoise)+ ") | Volume : " + WriteIf(V> Ref(V, -1),EncodeColor(colorBrightGreen),EncodeColor(colorRed))+ WriteVal(V,1)
;
_SECTION_END();
_SECTION_BEGIN("Haiken");
Show_color = ParamToggle("Display CandleColor", "No|Yes", 1);
r1 =5; //Param( "ColorFast avg", 5, 2, 200, 1 );
r2 =10; //Param( "ColorSlow avg", 10, 2, 200, 1 );
r3 =5; //Param( "ColorSignal avg", 5, 2, 200, 1 );
Prd1=4; //Param("ATR Period",4,1,20,1);
Prd2=7; //Param("Look Back",7,1,20,1);
green = HHV(LLV(L,Prd1)+ATR(Prd1),Prd2);
red = LLV(HHV(H,Prd1)-ATR(Prd1),Prd2);
HaClose =EMA((O+H+L+C)/4,3); // Woodie
//HaClose =(O+H+L+C)/4;
HaOpen = AMA( Ref( HaClose, -1 ), 0.5 );
HaHigh = Max( H, Max( HaClose, HaOpen ) );
HaLow = Min( L, Min( HaClose, HaOpen ) );
//HaClose = ( HaClose + HaOpen + HaHigh + HaLow )/4; // // Velvoort is using not original, but modified Heikin-Ashi close
Temp = Max(High, HaOpen);
Temp = Min(Low,HaOpen);
m1=MACD(r1,r2);
s1=Signal(r1,r2,r3);
mycolor=IIf(m1<0 AND m1>s1, ColorRGB(230,230,0),IIf(m1>0 AND m1>s1,colorBrightGreen,IIf(m1>0 AND m1<s1,colorOrange,colorDarkRed)));
if(Show_color)
{
ColorHighliter = myColor;
SetBarFillColor( ColorHighliter );
}
//////////
m1=MACD(r1,r2);
s1=Signal(r1,r2,r3);
mycolor=IIf(m1<0 AND m1>s1, ColorRGB(230,230,0),IIf(m1>0 AND m1>s1,colorWhite,IIf(m1>0 AND m1<s1,colorOrange,colorDarkRed)));
if(Show_color)
{
ColorHighliter = mycolor;
SetBarFillColor( ColorHighliter );
}
barColor=IIf(C>Green ,colorWhite,IIf(C < RED,colorRed,colorYellow));
barColor2=IIf(Close > Open, colorWhite, colorRed);
if( ParamToggle("Plot Normal Candle", "No,Yes", 1 ) )
PlotOHLC( HaOpen, HaHigh, HaLow, HaClose, " " , barcolor, styleCandle | styleThick );
else
PlotOHLC( Open, High, Low, Close, " " , barcolor2, styleCandle | styleThick );
_SECTION_END();
_SECTION_BEGIN("Breakout Setting");
Buyperiods=Param("Breakout periods best is usually 18",5,1,100,1,1);
Sellperiods=Param("Exit Breakout",5,1,100,1,1);
Buy= C>Ref(HHV(High,Buyperiods),-1);
Sell= C<Ref(LLV(Low,Sellperiods),-1);
/* exrem is one method to remove surplus strade signals. It removes excessive signals of arrow */
Buy = ExRem(Buy, Sell);
Sell = ExRem(Sell, Buy);
PlotShapes( IIf( Buy, shapeSmallCircle, shapeNone ), colorWhite, layer = 0,yposition = HaLow, offset = -10);
//PlotShapes( IIf( Buy, shapeSmallCircle, shapeNone ), colorWhite, layer = 0,yposition = HaLow, offset = -8);
PlotShapes( IIf( Sell, shapeSmallCircle, shapeNone ), colorRed, layer = 0, yposition = HaHigh, offset = 10);
//PlotShapes( IIf( Sell, shapeSmallCircle, shapeNone ), colorRed, layer = 0, yposition = HaHigh, offset = 8);
_SECTION_END();
_SECTION_BEGIN("Pivot Box");
Hi=Param("High_Period",7,1,50,1);
Lo=Param("Low_Period",7,1,50,1);
A1=ExRemSpan(Ref(High,-2)==HHV(High,Hi),3);
A2=ExRemSpan(Ref(Low,-2)==LLV(Low,Lo),3);
A3=Cross(A1,0.9);
A4=Cross(A2,0.9);
TOP=Ref(HaHigh,-BarsSince(A3));
breakoutLine=Param("BrOutLineLength",10,2,30,0.1);
upDaysback1 = breakoutLine;
upFirstBar1 = BarCount - upDaysBack1;
upst2=TOP;
upYYY2=IIf(BarIndex() >= upFirstbar1,EndValue(upSt2),Null);
Plot(upYYY2,"",ParamColor("BreakoutColor", colorOrange) ,ParamStyle("BreakoutLine",styleLine|styleThick|styleStaircase,maskAll));
//Plot(top,"",11,styleDots+styleLine+styleThick);
bot=Ref(HaLow,-BarsSince(A4));
breakDownLine=Param("BrDownLineLength",10,2,30,0.1);
dnDaysback1 = breakDownLine;
dnFirstBar1 = BarCount - dnDaysBack1;
dnst2=BOT;
dnYYY2=IIf(BarIndex() >= dnFirstbar1,EndValue(dnSt2),Null);
Plot(dnYYY2,"",ParamColor("BreakDownColor", colorBrightGreen) ,ParamStyle("BreakdownLine",styleLine|styleThick|styleStaircase,maskAll));
//Plot(bot,"",6,styleDots+styleLine);
_SECTION_END();
#include <T3.AFL>;
//**********************************************************************************
// Plot price horizontal line *
//**********************************************************************************/
_SECTION_BEGIN("Price Line");
PriceLineColor=colorGrey40; //ParamColor("PriceLineColor",ColorRGB(82,82,82));
PriceLevel = ParamField("PriceField", field = 3 );
Daysback = Param("Bars Back",500,10,900,1);
FirstBar = BarCount - DaysBack;
YY = IIf(BarIndex() >= Firstbar,EndValue(PriceLevel),Null);
Plot(YY,"Current Price",PriceLineColor,ParamStyle("LineStyle",styleLine|styleDashed|styleNoTitle|styleNoLabel|styleThick,maskAll));
_SECTION_END();
_SECTION_BEGIN("Average 0");
//Average_switch = ParamToggle("Candle On/off", "Off|On");
P = HaClose;
Type = ParamList("Type", "Weighted,Lagless-21,Hull-26,Linear
Regression-45,Exponential,Double Exponential,Tripple
Exponential,Wilders,Simple");
Periods = Param("Periods", 20, 2, 200 );
Displacement = Param("Displacement", 1, -50, 50 );
m = 0;
if( Type == "Weighted" ) m= WMA( P, Periods );
if( Type == "Lagless-21" ) m= 2*EMA(P, Periods)-EMA(EMA(P, Periods),
Periods);
if( Type == "Hull-26" ) m= WMA(2*(WMA(P, Periods/2))-WMA(P, Periods) ,4
);
if( Type == "Linear Regression-45" ) m= LinearReg( P, Periods );
if( Type == "Exponential" ) m = EMA( P, Periods );
if( Type == "Double Exponential" ) m = DEMA( P, Periods );
if( Type == "Tripple Exponential" ) m = TEMA( P, Periods );
if( Type == "Wilders" ) m = Wilders( P, Periods );
if( Type == "Simple" ) m = MA( P, Periods );
Plot( m, _DEFAULT_NAME(), ParamColor("Color", colorDarkYellow),ParamStyle("Style",styleLine |styleThick|styleDots|styleNoTitle ,maskAll),Displacement );
_SECTION_END();
_SECTION_BEGIN("Average 1");
//Average_switch = ParamToggle("Candle On/off", "Off|On");
P = HaClose;
Type = ParamList("Type", "Weighted,Lagless-21,Hull-26,Linear
Regression-45,Exponential,Double Exponential,Tripple
Exponential,Wilders,Simple");
Periods = Param("Periods", 60, 2, 200 );
Displacement = Param("Displacement", 1, -50, 50 );
m = 0;
if( Type == "Weighted" ) m= WMA( P, Periods );
if( Type == "Lagless-21" ) m= 2*EMA(P, Periods)-EMA(EMA(P, Periods),
Periods);
if( Type == "Hull-26" ) m= WMA(2*(WMA(P, Periods/2))-WMA(P, Periods) ,4
);
if( Type == "Linear Regression-45" ) m= LinearReg( P, Periods );
if( Type == "Exponential" ) m = EMA( P, Periods );
if( Type == "Double Exponential" ) m = DEMA( P, Periods );
if( Type == "Tripple Exponential" ) m = TEMA( P, Periods );
if( Type == "Wilders" ) m = Wilders( P, Periods );
if( Type == "Simple" ) m = MA( P, Periods );
Plot( m, _DEFAULT_NAME(), ParamColor("Color", colorDarkGreen),ParamStyle("Style",styleLine |styleThick|styleDots|styleNoTitle ,maskAll),Displacement );
_SECTION_END();
_SECTION_BEGIN("Average 2");
//Average_switch = ParamToggle("Candle On/off", "Off|On");
P = HaClose;
Type = ParamList("Type", "Weighted,Lagless-21,Hull-26,Linear
Regression-45,Exponential,Double Exponential,Tripple
Exponential,Wilders,Simple");
Periods = Param("Periods", 100, 2, 200 );
Displacement = Param("Displacement", 1, -50, 50 );
m = 0;
if( Type == "Weighted" ) m= WMA( P, Periods );
if( Type == "Lagless-21" ) m= 2*EMA(P, Periods)-EMA(EMA(P, Periods),
Periods);
if( Type == "Hull-26" ) m= WMA(2*(WMA(P, Periods/2))-WMA(P, Periods) ,4
);
if( Type == "Linear Regression-45" ) m= LinearReg( P, Periods );
if( Type == "Exponential" ) m = EMA( P, Periods );
if( Type == "Double Exponential" ) m = DEMA( P, Periods );
if( Type == "Tripple Exponential" ) m = TEMA( P, Periods );
if( Type == "Wilders" ) m = Wilders( P, Periods );
if( Type == "Simple" ) m = MA( P, Periods );
Plot( m, _DEFAULT_NAME(), ParamColor("Color", ColorRGB(70,70,70)),ParamStyle("Style",styleLine |styleThick|stylehidden|styleDots|styleNoTitle ,maskAll),Displacement );
_SECTION_END();
_SECTION_BEGIN("Average 5");
P = HaClose;
Type = ParamList("Type", "Weighted,Lagless-21,Hull-26,Linear
Regression-45,Exponential,Double Exponential,Tripple
Exponential,Wilders,Simple");
Periods = Param("Periods", 120 ,2, 200 );
Displacement = Param("Displacement", 1, -50, 50 );
m = 0;
if( Type == "Weighted" ) m= WMA( P, Periods );
if( Type == "Lagless-21" ) m= 2*EMA(P, Periods)-EMA(EMA(P, Periods),
Periods);
if( Type == "Hull-26" ) m= WMA(2*(WMA(P, Periods/2))-WMA(P, Periods) ,4
);
if( Type == "Linear Regression-45" ) m= LinearReg( P, Periods );
if( Type == "Exponential" ) m = EMA( P, Periods );
if( Type == "Double Exponential" ) m = DEMA( P, Periods );
if( Type == "Tripple Exponential" ) m = TEMA( P, Periods );
if( Type == "Wilders" ) m = Wilders( P, Periods );
if( Type == "Simple" ) m = MA( P, Periods );
Plot( m, _DEFAULT_NAME(), ParamColor("Color", colorCustom13),ParamStyle("Style",styleLine |styleThick|styleDots|styleNoTitle ,maskAll),Displacement );
_SECTION_END();
_SECTION_BEGIN("Sell Average 3");
P = HaClose;
Type = ParamList("Type", "Weighted,Lagless-21,Hull-26,Linear
Regression-45,Exponential,Double Exponential,Tripple
Exponential,Wilders,Simple");
Periods = Param("Periods", 180, 2, 800 );
Displacement = Param("Displacement", 1, -50, 50 );
m = 0;
if( Type == "Weighted" ) m= WMA( P, Periods );
if( Type == "Lagless-21" ) m= 2*EMA(P, Periods)-EMA(EMA(P, Periods),
Periods);
if( Type == "Hull-26" ) m= WMA(2*(WMA(P, Periods/2))-WMA(P, Periods) ,4
);
if( Type == "Linear Regression-45" ) m= LinearReg( P, Periods );
if( Type == "Exponential" ) m = EMA( P, Periods );
if( Type == "Double Exponential" ) m = DEMA( P, Periods );
if( Type == "Tripple Exponential" ) m = TEMA( P, Periods );
if( Type == "Wilders" ) m = Wilders( P, Periods );
if( Type == "Simple" ) m = MA( P, Periods );
Plot( m, _DEFAULT_NAME(), ParamColor("Color", ColorRGB(150,150,150)),ParamStyle("Style",styleLine |styleThick|styleDots|styleNoTitle ,maskAll),Displacement );
_SECTION_END();
_SECTION_BEGIN("Average 4");
P = HaClose;
Type = ParamList("Type", "Weighted,Lagless-21,Hull-26,Linear
Regression-45,Exponential,Double Exponential,Tripple
Exponential,Wilders,Simple");
Periods = Param("Periods", 500, 2, 800 );
Displacement = Param("Displacement", 1, -50, 50 );
m = 0;
if( Type == "Weighted" ) m= WMA( P, Periods );
if( Type == "Lagless-21" ) m= 2*EMA(P, Periods)-EMA(EMA(P, Periods),
Periods);
if( Type == "Hull-26" ) m= WMA(2*(WMA(P, Periods/2))-WMA(P, Periods) ,4
);
if( Type == "Linear Regression-45" ) m= LinearReg( P, Periods );
if( Type == "Exponential" ) m = EMA( P, Periods );
if( Type == "Double Exponential" ) m = DEMA( P, Periods );
if( Type == "Tripple Exponential" ) m = TEMA( P, Periods );
Plot( m, _DEFAULT_NAME(), ParamColor("Color", ColorRGB(190,190,190)),ParamStyle("Style",styleLine |styleThick|stylehidden|styleDots|styleNoTitle ,maskAll),Displacement );
_SECTION_END();
_SECTION_BEGIN("Bands_Short");
BandDays= Param("DaysBack",40,10,900,1);
HighestHigh = HHV( H, BandDays ) ;
LowestLow = LLV( L, BandDays) ;
KS = ( HHV( H, BandDays ) + LLV( L, BandDays) )/2;
//Plot(HighestHigh ,"HighestHigh ",colorBlue,styleLine | styleStaircase|styleNoRescale| styleNoLabel|styleNoTitle );
//Plot(LowestLow ,"LowestLow ",colorRed,styleLine | styleStaircase );
//Plot(KS,"KS",colorGreen,styleLine |styleThick | styleStaircase );
//Plot((KS+HighestHigh )/2,"",colorYellow, styleLine | styleThick | styleStaircase );
//Plot((KS+LowestLow )/2,"",colorYellow, styleLine | styleThick | styleStaircase );
CloudUpColor1=ParamColor("ShortupColor1",ColorRGB(0,55,55));
CloudUpColor2=ParamColor("ShortupColor2",ColorRGB(60,15,0));
CloudDownColor1=ParamColor("ShortDnColor1",ColorRGB(0,0,83));
CloudDownColor2= ParamColor("ShortDnColor2",ColorRGB(43,43,89));
CU1=HighestHigh;
CU2=(KS+HighestHigh )/2;
CD1=LowestLow = LLV( L, 22) ;
CD2=(KS+LowestLow )/2;
PlotOHLC( CU1, CU1,CU2,CU2, "", CloudUpColor1, styleCloud || styleStaircase|styleNoRescale| styleNoLabel|styleNoTitle );
PlotOHLC( CU2, CU2,KS,KS, "", CloudUpColor2, styleCloud || styleStaircase|styleNoRescale| styleNoLabel|styleNoTitle );
PlotOHLC( KS, KS,CD2,CD2, "", CloudDownColor1, styleCloud || styleStaircase|styleNoRescale| styleNoLabel|styleNoTitle );
PlotOHLC( CD2, CD2,CD1,CD1, "", CloudDownColor2, styleCloud || styleStaircase|styleNoRescale| styleNoLabel|styleNoTitle );
_SECTION_END();
_SECTION_BEGIN("Bands_Long");
SupResB = Param("Sup-Res Short",30,0,100,1);
//SupResB2 = Param("Sup-Res Short2",12,0,100,1);
SupResC=Param("Res Long",160,0,350,1);
ResL=Param("SupLong",60,0,350,1);
nn=SupResB;
nn2=SupResC;
nn3=ResL;
Hh=HHV(HaHigh,nn);
Ll=LLV(HaLow,nn);
Hh2=HHV(HaHigh,nn2);
L2=LLV(HaLow,nn3);
//Plot(Hh2,"",ColorRGB(13,32,29),ParamStyle("LongResLine",styleLine|styleStaircase|styleNoRescale |styleNoTitle|styleNoLabel|styleThick,maskAll));
//Plot(L2,"",ColorRGB(12,12,52),ParamStyle("LongSupLine",styleLine|styleStaircase|styleNoRescale |styleNoTitle|styleNoLabel|styleThick,maskAll));
_SECTION_END();
_SECTION_BEGIN("Cloud Setting Long");
//Cloud
ParmCloud = ParamToggle("CloudLong", "No|Yes", 1);
CloudResColor=ParamColor("CloudResColorLong",colorDarkGrey);
BrCount7=Param("CloudResLengthLong",300,1,500,1);
for (i=0;i<BarCount-BrCount7;i++) //hide the line except most recent 10 bars
{
CloudResColor = colorBlack;
}
CS1=LLV(HaLow,nn3);
CR1=HHV(HaHigh,nn2);
if(parmCloud == 1)
{
PlotOHLC( CS1, CS1, CR1,CR1, "", CloudResColor, styleCloud |styleStaircase| styleNoLabel|styleNoRescale |styleNoTitle);
}
_SECTION_END();
_SECTION_BEGIN("Pivot");
nBars = Param("Number of bars", 25, 5, 40);
LP=Param("LookBack Period",250,1,500,1);
bShowTCZ = Param("Show TCZ", 0, 0, 1);
nExploreBarIdx = 0;
nExploreDate = 0;
nCurDateNum = 0;
DN = DateNum();
DT = DateTime();
bTCZLong = False;
bTCZShort = False;
nAnchorPivIdx = 0;
ADX8 = ADX(8);
if(Status("action")==1) {
bDraw = True;
bUseLastVis = 1;
} else {
bDraw = False;
bUseLastVis = False;
bTrace = 1;
nExploreDate = Status("rangetodate");
for (i=LastValue(BarIndex());i>=0;i--) {
nCurDateNum = DN;
if (nCurDateNum == nExploreDate) {
nExploreBarIdx = i;
}
}
}
GraphXSpace=7;
if (bDraw) {
}
aHPivs = H - H;
aLPivs = L - L;
aHPivHighs = H - H;
aLPivLows = L - L;
aHPivIdxs = H - H;
aLPivIdxs = L - L;
aAddedHPivs = H - H;
aAddedLPivs = L - L;
aLegVol = H - H;
aRetrcVol = H - H;
nHPivs = 0;
nLPivs = 0;
lastHPIdx = 0;
lastLPIdx = 0;
lastHPH = 0;
lastLPL = 0;
curPivBarIdx = 0;
aHHVBars = HHVBars(H, nBars);
aLLVBars = LLVBars(L, nBars);
aHHV = HHV(H, nBars);
aLLV = LLV(L, nBars);
nLastVisBar = LastValue(
Highest(IIf(Status("barvisible"), BarIndex(), 0)));
curBar = IIf(nlastVisBar > 0 AND bUseLastVis, nlastVisBar,
IIf(Status("action")==4 AND nExploreBarIdx > 0, nExploreBarIdx,
LastValue(BarIndex())));
curTrend = "";
if (aLLVBars[curBar] < aHHVBars[curBar])
curTrend = "D";
else
curTrend = "U";
if (curBar >= LP) {
for (i=0; i<LP; i++) {
curBar = IIf(nlastVisBar > 0 AND bUseLastVis,
nlastVisBar-i,
IIf(Status("action")==4 AND nExploreBarIdx > 0,
nExploreBarIdx-i,
LastValue(BarIndex())-i));
if (aLLVBars[curBar] < aHHVBars[curBar]) {
if (curTrend == "U") {
curTrend = "D";
curPivBarIdx = curBar - aLLVBars[curBar];
aLPivs[curPivBarIdx] = 1;
aLPivLows[nLPivs] = L[curPivBarIdx];
aLPivIdxs[nLPivs] = curPivBarIdx;
nLPivs++;
}
} else {
if (curTrend == "D") {
curTrend = "U";
curPivBarIdx = curBar - aHHVBars[curBar];
aHPivs[curPivBarIdx] = 1;
aHPivHighs[nHPivs] = H[curPivBarIdx];
aHPivIdxs[nHPivs] = curPivBarIdx;
nHPivs++;
}
}
}
}
curBar =
IIf(nlastVisBar > 0 AND bUseLastVis,
nlastVisBar,
IIf(Status("action")==4 AND nExploreBarIdx > 0,
nExploreBarIdx,
LastValue(BarIndex()))
);
if (nHPivs >= 2 AND nLPivs >= 2) {
lastLPIdx = aLPivIdxs[0];
lastLPL = aLPivLows[0];
lastHPIdx = aHPivIdxs[0];
lastHPH = aHPivHighs[0];
nLastHOrLPivIdx = Max(lastLPIdx, lastHPIdx);
nAddPivsRng = curBar - nLastHOrLPivIdx;
aLLVAfterLastPiv = LLV(L, nAddPivsRng);
nLLVAfterLastPiv = aLLVAfterLastPiv[curBar];
aLLVIdxAfterLastPiv = LLVBars(L, nAddPivsRng);
nLLVIdxAfterLastPiv = curBar - aLLVIdxAfterLastPiv[curBar];
aHHVAfterLastPiv = HHV(H, nAddPivsRng);
nHHVAfterLastPiv = aHHVAfterLastPiv[curBar];
aHHVIdxAfterLastPiv = HHVBars(H, nAddPivsRng);
nHHVIdxAfterLastPiv = curBar - aHHVIdxAfterLastPiv[curBar];
if (lastHPIdx > lastLPIdx) {
/* There are at least two possibilities here. One is that
the previous high was higher, indicating that this is a
possible short retracement or one in the making.
The other is that the previous high was lower, indicating
that this is a possible long retracement in the working.
However, both depend on opposing pivots. E.g., if I find
higher highs, what if I have lower lows?
If the highs are descending, then I can consider:
- a lower low, and leave it at that
- a higher high and higher low
- a lower low and another lower high
*/
if (aHPivHighs[0] < aHPivHighs[1]) {
if (nLLVAfterLastPiv < aLPivLows[0] AND
(nLLVIdxAfterLastPiv - lastHPIdx - 1) >= 1
AND nLLVIdxAfterLastPiv != curBar ) {
// -- OK, we'll add this as a pivot.
// Mark it for plotting...
aLPivs[nLLVIdxAfterLastPiv] = 1;
aAddedLPivs[nLLVIdxAfterLastPiv] = 1;
// ...and then rearrange elements in the
// pivot information arrays
for (j=0; j<nLPivs; j++) {
aLPivLows[nLPivs-j] = aLPivLows[nLPivs-(j+1)];
aLPivIdxs[nLPivs-j] = aLPivIdxs[nLPivs-(j+1)];
}
aLPivLows[0] = nLLVAfterLastPiv;
aLPivIdxs[0] = nLLVIdxAfterLastPiv;
nLPivs++;
// -- Test whether to add piv given last piv is high
// AND we have lower highs
}
// -- Here, the last piv is a high piv, and we have
// higher-highs. The most likely addition is a
// Low piv that is a retracement.
} else {
if (nLLVAfterLastPiv > aLPivLows[0] AND
(nLLVIdxAfterLastPiv - lastHPIdx - 1) >= 1
AND nLLVIdxAfterLastPiv != curBar ) {
// -- OK, we'll add this as a pivot.
// Mark it for plotting...
aLPivs[nLLVIdxAfterLastPiv] = 1;
aAddedLPivs[nLLVIdxAfterLastPiv] = 1;
// ...and then rearrange elements in the
// pivot information arrays
for (j=0; j<nLPivs; j++) {
aLPivLows[nLPivs-j] = aLPivLows[nLPivs-(j+1)];
aLPivIdxs[nLPivs-j] = aLPivIdxs[nLPivs-(j+1)];
}
aLPivLows[0] = nLLVAfterLastPiv;
aLPivIdxs[0] = nLLVIdxAfterLastPiv;
nLPivs++;
// -- Test whether to add piv given last piv is high
// AND we have lower highs
}
// -- The last piv is a high and we have higher highs
// OR lower highs
}
/* ****************************************************************
Still finding missed pivot(s). Here, the last piv is a low piv.
**************************************************************** */
} else {
// -- First case, lower highs
if (aHPivHighs[0] < aHPivHighs[1]) {
if (nHHVAfterLastPiv < aHPivHighs[0] AND
(nHHVIdxAfterLastPiv - lastLPIdx - 1) >= 1
AND nHHVIdxAfterLastPiv != curBar ) {
// -- OK, we'll add this as a pivot.
// Mark that for plotting
aHPivs[nHHVIdxAfterLastPiv] = 1;
aAddedHPivs[nHHVIdxAfterLastPiv] = 1;
// ...and then rearrange elements in the
// pivot information arrays
for (j=0; j<nHPivs; j++) {
aHPivHighs[nHPivs-j] = aHPivHighs[nHPivs-(j+1)];
aHPivIdxs[nHPivs-j] = aHPivIdxs[nhPivs-(j+1)];
}
aHPivHighs[0] = nHHVAfterLastPiv;
aHPivIdxs[0] = nHHVIdxAfterLastPiv;
nHPivs++;
// -- Test whether to add piv given last piv is high
// AND we have lower highs
}
// -- Second case when last piv is a low piv, higher highs
// Most likely addition is high piv that is a retracement.
// Considering adding a high piv as long as it is higher
} else {
// -- Where I have higher highs,
if (nHHVAfterLastPiv > aHPivHighs[0] AND
(nHHVIdxAfterLastPiv - lastLPIdx - 1) >= 1
AND nHHVIdxAfterLastPiv != curBar ) {
// -- OK, we'll add this as a pivot.
// Mark it for plotting...
aHPivs[nHHVIdxAfterLastPiv] = 1;
aAddedHPivs[nHHVIdxAfterLastPiv] = 1;
// ...and then rearrange elements in the
// pivot information arrays
for (j=0; j<nHPivs; j++) {
aHPivHighs[nHPivs-j] = aHPivHighs[nHPivs-(j+1)];
aHPivIdxs[nHPivs-j] = aHPivIdxs[nhPivs-(j+1)];
}
aHPivHighs[0] = nHHVAfterLastPiv;
aHPivIdxs[0] = nHHVIdxAfterLastPiv;
nHPivs++;
// -- Test whether to add piv given last piv is high
// AND we have lower highs
}
}
}
// -- If there are at least two of each
}
/* ****************************************
// -- Done with finding pivots
***************************************** */
if (bDraw) {
// -- OK, let's plot the pivots using arrows
/*PlotShapes( IIf(aHPivs==1, shapeHollowSmallSquare, shapeNone), colorRed, layer = 0, yposition = HaHigh, offset = 10);
PlotShapes( IIf(aHPivs==1, shapeSmallCircle, shapeNone), colorRed, layer = 0, yposition = HaHigh, offset = 10);
PlotShapes( IIf(aAddedLPivs==1, shapeHollowSmallSquare, shapeNone), colorYellow, layer = 0, yposition = HaLow, offset = -10);
PlotShapes( IIf(aAddedLPivs==1, shapeSquare, shapeNone), colorBlack, layer = 0, yposition = HaLow, offset = -14);
//PlotShapes( IIf(aAddedLPivs==1, shapeSmallCircle, shapeNone), colorYellow, layer = 0, yposition = HaLow, offset = -9);*/
//PlotShapes( IIf(aHPivs==1, shapeSmallCircle, shapeNone), colorCustom12, layer = 0, yposition = HaHigh, offset = 9);
PlotShapes( IIf(aHPivs==1, shapeHollowSmallSquare, shapeNone), colorCustom12, layer = 0, yposition = HaHigh, offset = 12);
//PlotShapes( IIf(aAddedHPivs==1, shapeSmallCircle, shapeNone), colorCustom10,layer = 0, yposition = HaHigh, offset = 9);
PlotShapes( IIf(aAddedHPivs==1, shapeHollowSmallSquare, shapeNone), colorYellow, layer = 0, yposition = HaHigh, offset = 12);
//PlotShapes( IIf(aLPivs==1, shapeSmallCircle, shapeNone), colorPaleGreen, layer = 0, yposition = HaLow, offset = -9);
PlotShapes( IIf(aLPivs==1, shapeHollowSmallSquare, shapeNone), colorGreen, layer = 0, yposition = HaLow, offset = -12);
//PlotShapes( IIf(aAddedLPivs==1, shapeSmallCircle, shapeNone), colorYellow, layer = 0, yposition = HaLow, offset = -10);
PlotShapes( IIf(aAddedLPivs==1, shapeHollowSmallSquare, shapeNone), colorYellow, layer = 0, yposition = HaLow, offset = -13);
}
/* ****************************************
// -- Done with discovering and plotting pivots
***************************************** */
// -- I'm going to want to look for possible retracement
risk = 0;
profInc = 0;
nLeg0Pts = 0;
nLeg0Bars = 0;
nLeg0Vol = 0;
nLeg1Pts = 0;
nLeg1Bars = 0;
nLeg1Vol = 0;
nLegBarsDiff = 0;
nRtrc0Pts = 0;
nRtrc0Bars = 0;
nRtrc0Vol = 0;
nRtrc1Pts = 0;
nRtrc1Bars = 0;
nRtrc1Vol = 0;
minRtrc = 0;
maxRtrc = 0;
minLine = 0;
maxLine = 0;
triggerLine = 0;
firstProfitLine = 0;
triggerInc = 0;
triggerPrc = 0;
firstProfitPrc = 0;
retrcPrc = 0;
retrcBar = 0;
retrcBarIdx = 0;
retrcRng = 0;
aRetrcPrc = H-H;
aRetrcPrcBars = H-H;
aRetrcClose = C;
retrcClose = 0;
// -- Do TCZ calcs. Arrangement of pivs very specific
// for this setup.
if (nHPivs >= 2 AND
nLPivs >=2 AND
aHPivHighs[0] > aHPivHighs[1] AND
aLPivLows[0] > aLPivLows[1]) {
tcz500 =
(aHPivHighs[0] -
(.5 * (aHPivHighs[0] - aLPivLows[1])));
tcz618 =
(aHPivHighs[0] -
(.618 * (aHPivHighs[0] - aLPivLows[1])));
tcz786 =
(aHPivHighs[0] -
(.786 * (aHPivHighs[0] - aLPivLows[0])));
retrcRng = curBar - aHPivIdxs[0];
aRetrcPrc = LLV(L, retrcRng);
aRetrcPrcBars = LLVBars(L, retrcRng);
retrcPrc = aRetrcPrc[curBar];
retrcBarIdx = curBar - aRetrcPrcBars[curBar];
retrcClose = aRetrcClose[retrcBarIdx];
// -- bTCZLong setup?
bTCZLong = (
// -- Are retracement levels arranged in
// tcz order?
// .500 is above .786 for long setups
tcz500 >= (tcz786 * (1 - .005))
AND
// .681 is below .786 for long setups
tcz618 <= (tcz786 * (1 + .005))
AND
// -- Is the low in the tcz range
// -- Is the close >= low of tcz range
// and low <= high of tcz range
retrcClose >= ((1 - .01) * tcz618)
AND
retrcPrc <= ((1 + .01) * tcz500)
);
// -- risk would be high of signal bar minus low of zone
//risk = 0;
// -- lower highs and lower lows
} else if (nHPivs >= 2 AND nLPivs >=2
AND aHPivHighs[0] < aHPivHighs[1]
AND aLPivLows[0] < aLPivLows[1]) {
tcz500 =
(aHPivHighs[1] -
(.5 * (aHPivHighs[1] - aLPivLows[0])));
tcz618 =
(aHPivHighs[0] -
(.618 * (aHPivHighs[1] - aLPivLows[0])));
tcz786 =
(aHPivHighs[0] -
(.786 * (aHPivHighs[0] - aLPivLows[0])));
retrcRng = curBar - aLPivIdxs[0];
aRetrcPrc = HHV(H, retrcRng);
retrcPrc = aRetrcPrc[curBar];
aRetrcPrcBars = HHVBars(H, retrcRng);
retrcBarIdx = curBar - aRetrcPrcBars[curBar];
retrcClose = aRetrcClose[retrcBarIdx];
bTCZShort = (
// -- Are retracement levels arranged in
// tcz order?
// .500 is below .786 for short setups
tcz500 <= (tcz786 * (1 + .005))
AND
// .681 is above .786 for short setups
tcz618 >= (tcz786 * (1 - .005))
AND
// -- Is the close <= high of tcz range
// and high >= low of tcz range
retrcClose <= ((1 + .01) * tcz618)
AND
retrcPrc >= ((1 - .01) * tcz500)
);
// -- Risk would be top of zone - low of signal bar
//risk = 0;
}
// -- Show zone if present
if (bTCZShort OR bTCZLong) {
// -- Be prepared to see symmetry
if (bTCZShort) {
if (aLPivIdxs[0] > aHPivIdxs[0]) {
// -- Valuable, useful symmetry information
nRtrc0Pts = aHPivHighs[0] - aLPivLows[1];
nRtrc0Bars = aHPivIdxs[0] - aLPivIdxs[1] + 1;
nRtrc1Pts = retrcPrc - aLPivLows[0];
nRtrc1Bars = retrcBarIdx - aLPivIdxs[0] + 1;
} else {
nRtrc0Pts = aHPivHighs[1] - aLPivLows[1];
nRtrc0Bars = aHPivIdxs[1] - aLPivIdxs[1] + 1;
nRtrc1Pts = aHPivHighs[0] - aLPivLows[0];
nRtrc1Bars = aHPivIdxs[0] - aLPivIdxs[0] + 1;
}
} else { // bLongSetup
if (aLPivIdxs[0] > aHPivIdxs[0]) {
nRtrc0Pts = aHPivHighs[0] - aLPivLows[1];
nRtrc0Bars = aHPivIdxs[0] - aLPivIdxs[1] + 1;
nRtrc1Pts = retrcPrc - aLPivLows[0];
nRtrc1Bars = retrcBarIdx - aLPivIdxs[0] + 1;
} else {
nRtrc0Pts = aHPivHighs[1] - aLPivLows[0];
nRtrc0Bars = aLPivIdxs[0] - aHPivIdxs[1] + 1;
nRtrc1Pts = aHPivHighs[0] - aLPivLows[0];
nRtrc1Bars = aLPivIdxs[0] - aHPivIdxs[0] + 1;
}
}
if (bShowTCZ) {
Plot(
LineArray( IIf(bTCZLong, aHPivIdxs[0], aLPivIdxs[0]),
tcz500, curBar, tcz500 , 0),
"tcz500", colorPaleBlue, styleLine);
Plot(
LineArray( IIf(bTCZLong, aHPivIdxs[0], aLPivIdxs[0]),
tcz618, curBar, tcz618, 0),
"tcz618", colorPaleBlue, styleLine);
Plot(
LineArray( IIf(bTCZLong, aHPivIdxs[0], aLPivIdxs[0]),
tcz786, curBar, tcz786, 0),
"tcz786", colorTurquoise, styleLine);
}
// -- if (bShowTCZ)
}
// **************************
// END INDICATOR CODE
// **************************
_SECTION_END();
///********************************************//
flowerClose = EMA((Open+High+Low+Close)/4,3) ;
flowerOpen = EMA((Ref(Open,-1) + Ref(flowerClose,-1))/2,3);
Temp = Max(High, flowerOpen);
flowerHigh = EMA(Max(Temp, flowerClose),3);
Temp = Min(Low,flowerOpen);
flowerLow = EMA(Min(Temp, flowerClose),3);
//------------//
//#include <T3.AFL>;
_SECTION_BEGIN("Weekly_trend");
//AT=ParamColor("AT", colorRed );
Prd1=4; //Param("Weekly_Period1",4,1,200,1);
Prd2=5;// Param("Weekly_Period2",5,1,200,1);
TimeFrameSet (inWeekly);
TM = T3 ( Close , Prd1 ) ;
TM2 = T3 ( Close , Prd2 ) ;
TimeFrameRestore();
BullishRevers=Close>TM AND Close<TM2;
Bullish=Close>TM AND Close>TM2;
BearishRevers=Close<TM AND Close>TM2;
Bearish=Close<TM AND Close<TM2;
Type1 = WriteIf( BullishRevers,"bullishrevers", "");
Type2 = WriteIf( Bullish,"bullish", "");
Type3 = WriteIf( BearishRevers,"bearishrevers", "");
Type4 = WriteIf( Bearish,"bearish", "");
RequestTimedRefresh( 0 );
GfxSelectFont( "Tahoma", 12, 100 );
GfxSetBkMode( 1 );
GfxSetTextColor( colorWhite );
if ( Type1 =="bullishrevers")
{
GfxSelectSolidBrush( colorYellow );
}
else
if ( Type2 =="bullish")
{
GfxSelectSolidBrush( ColorRGB(0,50,0));
}
else
if ( Type3 =="bearishrevers")
{
GfxSelectSolidBrush( colorGrey40 );
}
else
if ( Type4 =="bearish")
{
GfxSelectSolidBrush( ColorRGB(50,0,0));
}
GfxSelectPen( colorTeal,2 ); // broader color
//GfxRoundRect( 2,320,150,200, 5, 5 );
GfxCircle( 70,90,60 );
_SECTION_END();
_SECTION_BEGIN("trending ribbon");
//BT=ParamColor("BT", colorRed );
TimeFrameSet (inDaily);
uptrend=PDI()>MDI()AND Signal()<MACD();
downtrend=MDI()>PDI()AND Signal()>MACD();
UTM3=IIf( uptrend, colorGreen, IIf( downtrend, colorRed, colorLightGrey ));
TimeFrameRestore();
UpA=uptrend;
DownB=downtrend;
Trend1 = WriteIf( UpA,"Up1", "");
Trend2 = WriteIf( DownB,"Down1", "");
RequestTimedRefresh( 0 );
GfxSelectFont( "Tahoma", 12, 100 );
GfxSetBkMode( 1 );
GfxSetTextColor( colorWhite );
if ( Trend1 =="Up1")
{
GfxSelectSolidBrush( ColorRGB(0,70,0) );
}
else
if ( Trend2 =="Down1")
{
GfxSelectSolidBrush( ColorRGB(70,0,0));
}
else
if ( Trend2 =="")
{
GfxSelectSolidBrush( colorPaleBlue );
}
GfxSelectPen( colorBlack, 0 ); // broader color
//GfxRoundRect( 15,305,135,215, 5, 5 );
GfxCircle( 70,90,54 );
_SECTION_END();
_SECTION_BEGIN("Trendslong");
//CT=ParamColor("CT", colorRed );
UpTrendCond3 = Cross ( T3( flowerclose, 7), T3( flowerclose, 9) );
dnTrendCond3 = Cross ( T3( flowerclose, 9),T3( flowerclose, 7) );
upt3= T3( flowerclose, 7)> T3( flowerclose, 9) ;
dnTrend3 = T3( flowerclose, 9)>T3( flowerclose, 7) ;
//for Trend1
Trendslongup= WriteIf(upt3,"trendlongup", "");
Trendslongdown= WriteIf( dnTrend3,"trendlongdn", "");
//Trendslongcon= WriteIf( UpTrendCond3,"trendlongcon", "");
if ( Trendslongup =="trendlongup")
{
GfxSelectSolidBrush(ColorRGB(0,90,0) );
}
else
if (Trendslongdown =="trendlongdn")
{
GfxSelectSolidBrush( ColorRGB(90,0,0));
}
else
if (Trendslongdown =="")
{
GfxSelectSolidBrush( colorYellow );
}
GfxSelectFont( "Arial", 10, 100 );
GfxSetBkMode( 1 );
GfxSetTextColor( colorBlack );
GfxSelectPen( colorBlack, 1 ); // broader color
GfxCircle( 70,90,48 );
_SECTION_END();
_SECTION_BEGIN("Trendsmid");
//DT=ParamColor("DT", colorRed );
UpTrendCond2 = Cross ( T3( flowerclose, 5), T3( flowerclose, 7) );
dnTrendCond2 = Cross (T3( flowerclose, 7), T3( flowerclose, 5) );
upt2= T3( flowerclose, 5)> T3( flowerclose, 7) ;
dnTrend2 = T3( flowerclose, 7)>T3( flowerclose, 5) ;
//for trend2
Trendmidup= WriteIf(upt2,"trendmidup", "");
Trendmiddown= WriteIf( dnTrend2,"trendmiddn", "");
Trendmidcon= WriteIf( UpTrendCond2,"trendmidcon", "");
if ( Trendmidup =="trendmidup")
{
GfxSelectSolidBrush( ColorRGB(0,120,0) );
}
else
if (Trendmiddown =="trendmiddn")
{
GfxSelectSolidBrush( ColorRGB(120,0,0));
}
else
if (Trendmidcon =="trendmidcon")
{
GfxSelectSolidBrush( colorYellow );
}
GfxSelectFont( "Arial", 10, 100 );
GfxSetBkMode( 1 );
GfxSetTextColor( colorBlack );
GfxSelectPen( colorBlack, 1 ); // broader color
GfxCircle( 70,90,42 );
_SECTION_END();
_SECTION_BEGIN("Trendsshort");
//ET=ParamColor("ET", colorRed );
UpTrendCond1 = Cross( flowerClose, T3( flowerClose, 5 ) );
dnTrendCond1 = Cross( T3( flowerClose, 5 ),flowerClose );
upt1=flowerClose > T3( flowerClose, 5 ) ;
dnTrend1 = flowerClose< T3( flowerClose, 5 );
//for Trend1
Trendshortup= WriteIf(upt1,"trendup", "");
Trendshortdown= WriteIf( dnTrend1,"trenddn", "");
Trendshortcon= WriteIf( UpTrendCond1,"trendcon", "");
if ( Trendshortup =="trendup")
{
GfxSelectSolidBrush( ColorRGB(0,150,0) );
}
else
if (Trendshortdown =="trenddn")
{
GfxSelectSolidBrush( ColorRGB(150,0,0));
}
else
if (Trendshortcon =="trendcon")
{
GfxSelectSolidBrush( colorYellow );
}
GfxSelectFont( "Arial", 10, 100 );
GfxSetBkMode( 1 );
GfxSetTextColor( colorBlack );
GfxSelectPen( colorBlack, 1 ); // broader color
GfxCircle( 70,90,36 );
_SECTION_END();
_SECTION_BEGIN("Rays");
//FT=ParamColor("FT", colorRed );
Pp1=3;
Pp2=2;
CS33=HHV(LLV(flowerHigh,Pp1)-ATR(Pp2),4);
CR33=HHV(LLV(flowerHigh,Pp1)-ATR(Pp2),5);
AtrupTrendCond1 = flowerClose> CS33 ;
AtrdnTrendCond1 =CS33>flowerClose ;
ATRup = WriteIf(AtrupTrendCond1,"atrup", "");
ATRdown= WriteIf( AtrdnTrendCond1,"atrdn", "");
if ( ATRup =="atrup")
{
GfxSelectSolidBrush( ColorRGB(0,180,0) );
}
else
if (ATRdown =="atrdn")
{
GfxSelectSolidBrush( ColorRGB(180,0,0));
}
else
if ( ATRdown =="")
{
GfxSelectSolidBrush( colorGrey40 );
}
GfxSelectFont( "Arial", 10, 100 );
GfxSetBkMode( 1 );
GfxSetTextColor( colorBlack );
GfxSelectPen( colorBlack, 1 ); // broader color
GfxCircle( 70,90,30 );
_SECTION_END();
_SECTION_BEGIN("Exit_Beast-3");
//GT=ParamColor("GT", colorRed );
EntrylookbackPeriod=10;
EntryATRperiod=1.9;
EntrySig = C > ( LLV( flowerLow, EntrylookbackPeriod ) + EntryATRperiod * ATR( 10 ) );
ExitSig = C < ( HHV( flowerHigh, EntrylookbackPeriod ) -EntryATRperiod * ATR( 10 ) );
RequestTimedRefresh( 0 );
GfxSelectFont( "Tahoma", 12, 100 );
GfxSetBkMode( 1 );
GfxSetTextColor( colorWhite );
EntryB = WriteIf( EntrySig,"eu", "");
ExitB = WriteIf( ExitSig,"ed", "");
if ( EntryB =="eu")
{
GfxSelectSolidBrush( ColorRGB(0,210,0) );
}
else
if ( ExitB =="ed")
{
GfxSelectSolidBrush( ColorRGB(210,0,0));
}
else
if ( ExitB =="")
{
GfxSelectSolidBrush( colorGrey40 );
}
GfxSelectFont( "Arial", 10, 100 );
GfxSetBkMode( 1 );
GfxSetTextColor( colorBlack );
GfxSelectPen( colorBlack, 1 ); // broader color
GfxCircle( 70,90,24 );
_SECTION_END();
_SECTION_BEGIN("CCI9-2");
//HT=ParamColor("HT", colorRed );
ccidn=CCI(8) < 0;
cciup=CCI(9) > 0;
ccresult1 = WriteIf( cciup,"cu", "");
ccresult2 = WriteIf( ccidn,"cd", "");
RequestTimedRefresh( 0 );
GfxSelectFont( "Tahoma", 12, 100 );
GfxSetBkMode( 1 );
GfxSetTextColor( colorWhite );
if ( ccresult1 =="cu")
{
GfxSelectSolidBrush( ColorRGB(0,240,0) );
}
else
if ( ccresult2 =="cd")
{
GfxSelectSolidBrush( ColorRGB(240,0,0));
}
else
if ( ccresult2 =="")
{
GfxSelectSolidBrush( colorGrey40 );
}
GfxSelectFont( "Arial", 10, 100 );
GfxSetBkMode( 1 );
GfxSetTextColor( colorBlack );
GfxSelectPen( colorBlack, 1 ); // broader color
GfxCircle( 70,90,18 );
_SECTION_END();
_SECTION_BEGIN("%BB7-1");
//IT=ParamColor("IT", colorRed );
p=7;
x=((C+2*StDev(C,p)-MA(C,p))/(4*StDev(C,p)))*100;
bbdown= x < 40;
bbup= x > 40;
bbresult1 = WriteIf( bbup,"bu", "");
bbresult2 = WriteIf( bbdown,"bd", "");
bbresult3 = WriteIf( C,"bearishrevers", "");
RequestTimedRefresh( 0 );
GfxSelectFont( "Tahoma", 12, 100 );
GfxSetBkMode( 1 );
GfxSetTextColor( colorWhite );
if ( bbresult1 =="bu")
{
GfxSelectSolidBrush( ColorRGB(62,255,62) );
}
else
if ( bbresult2 =="bd")
{
GfxSelectSolidBrush( ColorRGB(255,62,62) );
}
else
if ( bbresult2 =="")
{
GfxSelectSolidBrush( colorGrey40 );
}
GfxSelectFont( "Arial", 10, 100 );
GfxSetBkMode( 1 );
GfxSetTextColor( colorBlack );
GfxSelectPen( colorBlack, 1 ); // broader color
GfxCircle( 70,90,12 );
_SECTION_END();
_SECTION_BEGIN("Fast_trend");
//JT=ParamColor("JT", colorRed );
Prd3=5; //Param("Daily_Period1",8,1,200,1);
Prd4=8; //Param("Daily_Period2",15,1,200,1);
TimeFrameSet (inDaily);
TM3 = T3 ( C , Prd3) ;
TM4 = T3 ( C , Prd4) ;
TimeFrameRestore();
A=C>TM3 AND C<TM4;
B=C>TM3 AND C>TM4;
C=C<TM3 AND C>TM4;
D=C<TM3 AND C<TM4;
result1 = WriteIf( A,"bullrevers", "");
result2 = WriteIf( B,"bull", "");
result3 = WriteIf( C,"bearishrevers", "");
result4 = WriteIf( D,"bear", "");
RequestTimedRefresh( 0 );
GfxSelectFont( "Tahoma", 12, 100 );
GfxSetBkMode( 1 );
GfxSetTextColor( colorWhite );
if ( result1 =="bullrevers")
{
GfxSelectSolidBrush( colorWhite );
}
else
if ( result2 =="bull")
{
GfxSelectSolidBrush( ColorRGB(113,255,113) );
}
else
if ( result3 =="bearishrevers")
{
GfxSelectSolidBrush( colorGrey40 );
}
else
if ( result4 =="bear")
{
GfxSelectSolidBrush( ColorRGB(255,113,113) );
OP = "M";
}
GfxSelectFont( "Arial", 10, 100 );
GfxSetBkMode( 1 );
GfxSetTextColor( colorBlack );
GfxSelectPen( colorBlack,1); // broader color
GfxCircle( 70,90,6 );
//GfxTextOut( OP ,92,235) ;
_SECTION_END();
Attachments
-
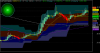 17.3 KB Views: 3,486
