


NIFTY FIFTY
- Thread starter AMITBE
- Start date
- Status
- Not open for further replies.

AMITBE said:
Hi Sanjay, the above were all well covered today.
To the bearish side I hadn't calculated for anything below 3406 and of course Fut. went much below.
Same with the upper line, but once 3500 was teken, there was not one hiccup.
Of the long range levels mentioned, 3544 was all but tested at 3542.80 high.
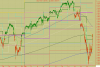
I've been trading off a combination of the levels I compute, and trendlines quite a lot, and for today the traded trendlines are shown on the chart.
This is the first time I've posted Futures data here, and did so since you'd queried it.
As this thread is not for trading calls on the Nifty, this is the last of this.
Hope that helped, Sanjay.
To the bearish side I hadn't calculated for anything below 3406 and of course Fut. went much below.
Same with the upper line, but once 3500 was teken, there was not one hiccup.
Of the long range levels mentioned, 3544 was all but tested at 3542.80 high.
I've been trading off a combination of the levels I compute, and trendlines quite a lot, and for today the traded trendlines are shown on the chart.
This is the first time I've posted Futures data here, and did so since you'd queried it.
As this thread is not for trading calls on the Nifty, this is the last of this.
Hope that helped, Sanjay.
A very nice technique indeed. similar to mine except for using of moving avgs instead of trendlines and these levels are not as dense as yours and i combine these with elliott wave principles.this chart would make it clear about what i am saying.these levels are taken based on daily,weekly and monthly movements.
AMITBE said:
This fall's quite over done for me vizzie.
If base metals are crashing, why are construction, reaity, hospitality, telecom, technology, banking, motors, bikes etc etc etc...why are all these falling.
Someone has to step forward and start buying, and there will be buying I belive.
Shorts will cover hard and there would be a relief rally.
At this point I'm not looking for supports, but levels to scale to the up, because supports don't matter. Each new breaking support is going to cause another fall.
So to the up, 3430-3435 has to be maintained.
Then 3438-3442-3443.
Then 3450-3454-3458-3462.
Above 3467 would be a nice recovery.
Then more later.
regards,
gvnarendra.
Attachments
-
 33.4 KB Views: 22
vizzie said:
Hi Amidta !!
Phew.. what a session...
hope no one here has done panic selling.
cause the way it has turned up.. seems like the gud old correction might be over..
cheers
vizzie
Phew.. what a session...
hope no one here has done panic selling.
cause the way it has turned up.. seems like the gud old correction might be over..
cheers
vizzie
Now whether this was a relief rally with more bleeding to come later, or if a bottom has been created for a rise on its way to previous levels over a period of time, has to be seen.
I'm long still and expect some crucial levels to be scaled to the up, taking the Nifty to relative safety.
There is a near ‘Hammer’ candlestick bar created on the daily charts of the Nifty.
I’m saying near Hammer because in a true Hammer there would normally be no upper shadow.
On yesterday’s bar there is a minute upper shadow that only means that the Nifty closed slightly below the day’s high. If the close had come at the high itself, then it would have been a perfect Hammer.
Even so, I’ll call it a hammer on not a Doji. That fact that it is a white candle makes it that much better.
The long lower tail basically indicates that the intraday sharp sell off was finally reversed and by close weak hands and short sellers were squeezed out.
The possibility of a reversal is strengthened by the white body. A strong market today would give confirmation.
Cheers vizzie.
Ahhh...one more thing vizzie...
I've just read this Hammer being incorrectly described as a Hanging Man in one of the threads at the forum.
Well, only in an uptrend a Hammer would be described as a Hanging Man, giving an indication that a bearish reversal may be coming ahead. The market recovered from the sell-off, but failed to scale new heights. Again, a weak next day on good volume is still needed to give confirmation.
Last edited:
AMITBE said:
Hi vizzieyes, quite a session wasnt it.
Now whether this was a relief rally with more bleeding to come later, or if a bottom has been created for a rise on its way to previous levels over a period of time, has to be seen.
I'm long still and expect some crucial levels to be scaled to the up, taking the Nifty to relative safety.
There is a near Hammer candlestick bar created on the daily charts of the Nifty.
Im saying near Hammer because in a true Hammer there would normally be no upper shadow.
On yesterdays bar there is a minute upper shadow that only means that the Nifty closed slightly below the days high. If the close had come at the high itself, then it would have been a perfect Hammer.
Even so, Ill call it a hammer on not a Doji. That fact that it is a white candle makes it that much better.
The long lower tail basically indicates that the intraday sharp sell off was finally reversed and by close weak hands and short sellers were squeezed out.
The possibility of a reversal is strengthened by the white body. A strong market today would give confirmation.
Cheers vizzie.
Ahhh...one more thing vizzie...
I've just read this Hammer being incorrectly described as a Hanging Man in one of the threads at the forum.
Well, only in an uptrend a Hammer would be described as a Hanging Man, giving an indication that a bearish reversal may be coming ahead. The market recovered from the sell-off, but failed to scale new heights. Again, a weak next day on good volume is still needed to give confirmation.
Hi Amitda !!
Yup.. today's session becomes all the more interesting..
it's rather strange how every time the market has been falling, it recovers so quickly and aggressively..
was readin an article where Stephen Roach, chief economist of Morgan Stanley, was quoted as now being "soft".
He is one man who was constantly shouting "bubble burst" since 2003.
On the flip side, the last time he was soft was in 1999, just before the..
Gr8 stuff Amitda ..
cheers
vizzie
Lot of work is still to be done despite the strong close last night.
I'm going to be busy for an hour or so, and so just the levels for now.
To the up, 3526-3529-3532-3535-3538-3541-3544-3547-3550.
Then 3557-3564-3571-3578.
Supports are 3522-3517-3514-3511-3508-3505-3502-3499-3496-3492.
Then 3488-3484-3480-3476-3472-3468.
3464 and 3459 look strong.
I'm going to be busy for an hour or so, and so just the levels for now.
To the up, 3526-3529-3532-3535-3538-3541-3544-3547-3550.
Then 3557-3564-3571-3578.
Supports are 3522-3517-3514-3511-3508-3505-3502-3499-3496-3492.
Then 3488-3484-3480-3476-3472-3468.
3464 and 3459 look strong.
AMITBE said:
Hi vizzieyes, quite a session wasnt it.
Now whether this was a relief rally with more bleeding to come later, or if a bottom has been created for a rise on its way to previous levels over a period of time, has to be seen.
I'm long still and expect some crucial levels to be scaled to the up, taking the Nifty to relative safety.
There is a near Hammer candlestick bar created on the daily charts of the Nifty.
Im saying near Hammer because in a true Hammer there would normally be no upper shadow.
On yesterdays bar there is a minute upper shadow that only means that the Nifty closed slightly below the days high. If the close had come at the high itself, then it would have been a perfect Hammer.
Even so, Ill call it a hammer on not a Doji. That fact that it is a white candle makes it that much better.
The long lower tail basically indicates that the intraday sharp sell off was finally reversed and by close weak hands and short sellers were squeezed out.
The possibility of a reversal is strengthened by the white body. A strong market today would give confirmation.
Cheers vizzie.
Ahhh...one more thing vizzie...
I've just read this Hammer being incorrectly described as a Hanging Man in one of the threads at the forum.
Well, only in an uptrend a Hammer would be described as a Hanging Man, giving an indication that a bearish reversal may be coming ahead. The market recovered from the sell-off, but failed to scale new heights. Again, a weak next day on good volume is still needed to give confirmation.
Now whether this was a relief rally with more bleeding to come later, or if a bottom has been created for a rise on its way to previous levels over a period of time, has to be seen.
I'm long still and expect some crucial levels to be scaled to the up, taking the Nifty to relative safety.
There is a near Hammer candlestick bar created on the daily charts of the Nifty.
Im saying near Hammer because in a true Hammer there would normally be no upper shadow.
On yesterdays bar there is a minute upper shadow that only means that the Nifty closed slightly below the days high. If the close had come at the high itself, then it would have been a perfect Hammer.
Even so, Ill call it a hammer on not a Doji. That fact that it is a white candle makes it that much better.
The long lower tail basically indicates that the intraday sharp sell off was finally reversed and by close weak hands and short sellers were squeezed out.
The possibility of a reversal is strengthened by the white body. A strong market today would give confirmation.
Cheers vizzie.
Ahhh...one more thing vizzie...
I've just read this Hammer being incorrectly described as a Hanging Man in one of the threads at the forum.
Well, only in an uptrend a Hammer would be described as a Hanging Man, giving an indication that a bearish reversal may be coming ahead. The market recovered from the sell-off, but failed to scale new heights. Again, a weak next day on good volume is still needed to give confirmation.
Saint
AMITBE said:
Ahhh...one more thing vizzie...
I've just read this Hammer being incorrectly described as a Hanging Man in one of the threads at the forum.
Well, only in an uptrend a Hammer would be described as a Hanging Man, giving an indication that a bearish reversal may be coming ahead. The market recovered from the sell-off, but failed to scale new heights. Again, a weak next day on good volume is still needed to give confirmation.
Took this note from net...any mistakes, seniors please correct...
Ganeshhity
Attachments
-
 2.8 KB Views: 16
hai seniors, please read thearticle below and infer why the market is so volatile. DE Shaw ( Hedge fund ) seems to have already entered indian stock markets
*****************************************************
FINANCIAL TIMES
April 12, 2002, Friday USA Edition 2
SECTION: GLOBAL INVESTING; Pg. 27
HEADLINE: Statistical arbitrage is stung by a more efficient market
BYLINE: By ROBERT CLOW
DATELINE: NEW YORK
Fund of hedge fund investors are becoming increasingly sceptical of statistical arbitrage as a hedge fund strategy.
They point to declining equity volatility and the increased efficiency of the equity market, arising from decimalisation, as two reasons why it is increasingly difficult for statistical arbitrage hedge funds to make money.
"Lower volatility and higher active trading makes it difficult to make money," said Barry Colvin, chief investment officer of Tremont Advisers, noting that some statistical arbitrageurs, who trade less frequently, continue to produce results. Mr Colvin noted that statistical arbitrage can take several forms, but generally the strategy involves buying and selling equities as they deviate from a historical range.
For example, if IBM rose sharply in price, a statistical arbitrageur might sell the stock short while buying a number of peer companies, such as Hewlett Packard. Such a trade should allow the arbitrageur to benefit from IBM's reversion to a more reasonable price while offering protection from a more general rally in the industry.
Statistical arbitrageurs usually rely on complex mathematical models to provide them with buy or sell signals. As a result some of the best-known quantitative names in hedge funds are active in this area.
DE Shaw is one of the best-known statistical arbitrage funds. Its results are understood to have held up well over the last year, but many of its peers are already suffering from the tough environment.
"Those that have tilted towards value have actually done OK," said Mr Colvin, noting that some of these funds have a growth or value bias like traditional equity funds. "Those that have no bias whatsoever have been pretty flat."
Most relative value hedge fund strategies either rely on volatility being high, as with this strategy, convertible arbitrage and global macro economic trading, or on volatility decreasing.
Mortgage arbitrage is one example of a so-called short volatility strategy, because the mortgage traders are short on the underlying mortgage refinancing options.
Equity volatility is declining now, partially as a result of the declining volume of money being pumped into the stock market by mutual fund investors.
Arthur Samberg, head of Pequot Capital Management, has said he expects hedge funds to struggle over the next few years as a result of this declining volatility.
The recent decimalisation of the stock market, which led to stocks going from being priced in eighths, quarters and halves to ten cent increments, has meant stock prices often move in smaller increments and therefore tend to overshoot less in response to news or data.
But that kind of increased efficiency is bad news for statistical arbitrageurs, whose whole strategy is based on profiting from stock prices overshooting for brief periods either on the upside or the downside
************************************************
Now we know why hedge funds are happy keeping a volatile market.
what is SEBI going to do about this
ravi1967 said:
hai seniors, please read thearticle below and infer why the market is so volatile. DE Shaw ( Hedge fund ) seems to have already entered indian stock markets
************************************************
Now we know why hedge funds are happy keeping a volatile market.
what is SEBI going to do about this
************************************************
Now we know why hedge funds are happy keeping a volatile market.
what is SEBI going to do about this
The political statement issued last week for cement had a negative impact on market.London stock exchange (and to a huge extent Luxemberg Stck Exch) thus saw huge down moments for metals.....moreover, more negative sentiments led the bear attack...the market panic and profitbooking took its toll and that took market to that depths....there were other factors for the downtrend which would be at micro levels...
Anyway, the market is overbought..the fundamentals are very strong...SEBI is on work this time and there is no market manipulator...be free..trade wise..
Best of luck !!!!!
ganeshhity
The markets internationally are deep down in red, whether the ones that are now closed out west, or the ones running ahead in time further east.
Everything is deep in red.
To my shocked surprise, there is no one here sounding a warning bell at this forum.
All I'm seeing is buy calls and more buy calls.
Come on people...please don't run ahead of yourselves.
Stay far from the markets today.
On another level, I'm not posting comments nor levels for the Nifty for now.
The reason is, the forum is not a place for learning as it once was.
Anyone serious about trading their hard earned money need to invest in learning at least some basics of the market, TA, FA etc.
I'm a student and a learner, and at this point this forum is not answering my needs.
Perhaps some debate could evolve on these issues.
Thank you all for all the learning and sharing.
- Status
- Not open for further replies.
| Thread starter | Similar threads | Forum | Replies | Date |
|---|---|---|---|---|
| S | EOD data for Nifty 50 with volume | Introductions | 0 | |
| V | Banknifty expiry date change | Options | 7 | |
| L | Nifty fifty and stock futures | Swing Trading | 13 | |
| M | Veluri Strategy intraday nifty fifty | Software | 96 | |
| T | Nifty Fifty Only + GOLD SILVER | Data Feeds | 0 |