


Nifty and Indian stocks
- Thread starter devadas
- Start date
DISCLAIMER: These notes/comments have been prepared solely to educate those who are interested in the useful application of Technical Analysis. While due care has been taken in preparing these notes/comments, no responsibility can be or is assumed for any consequences resulting out of acting on them.Trading in Stocks/Commodities/Futures Carry Risk.
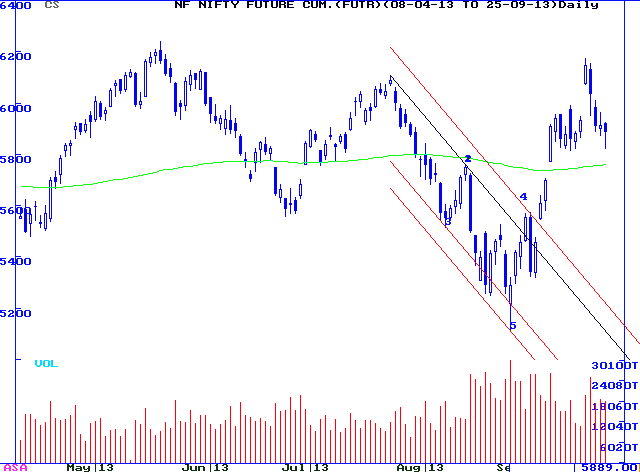
NIFTY FUTURES (6145.75 ) -108.25 6037.5
I received a lot of mails asking whether markets are bullish after the RBI announcement and what to do.Let me explain a bit if trading strategies.Entries are taken on pull backs of upward breakouts and pull backs to support as “RISK REWARD” ratio is favourable.Vice versa for bearishness.Arbitrary entries do not give a favourable risk – reward ratio.
Now in the current scenario, imagine a person did not take a position because of US FED and RBI policies.What he should do ?..Maybe he can enter on supports if he is bullish or sell on rallies near the all time highs around 6290 – 6348 with that as a stop if he is bearish.But he has to have a “view” on the markets.
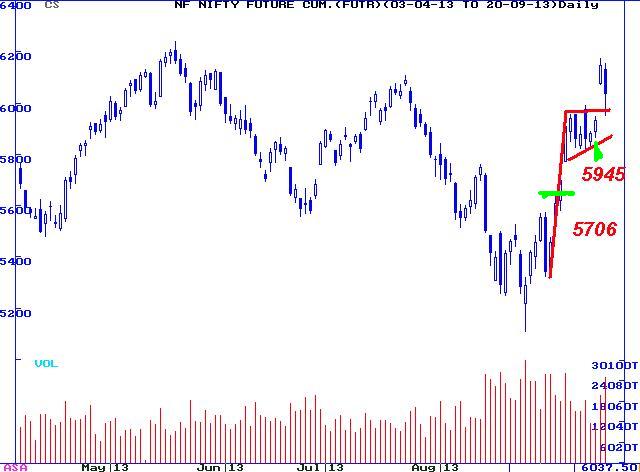
In my case, I had given buys at two points namely 5645 and 5889 ( see green points )and trail it.The flag formation is no doubt intact but a close below 5945 negates the flag and long positions have to be liquidated ( not short ).A close below 5706, will end the Uptrend.If market closes below 5945, I will sell the longs and wait for fresh patterns to emerge.
Resistance for the upmoves is at 6209.9 / 6349
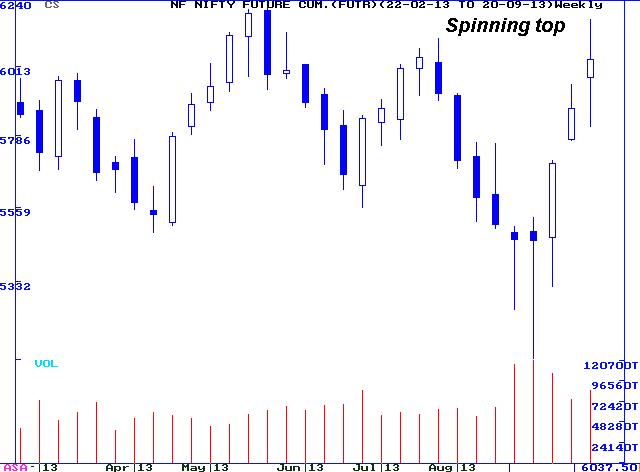
On the Weekly Charts, Nifty Futures have formed a spinning top which means markets are not decided on the future direction.
NIFTY DAILY
WEEKLY
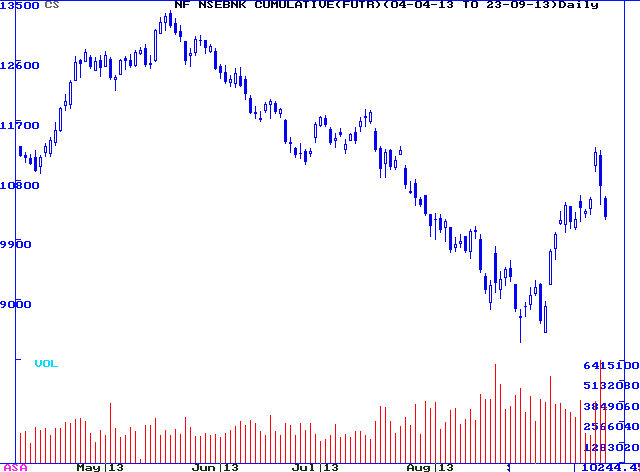
BANK NIFTY FUTURES (11214.1) -490.8 10722.3
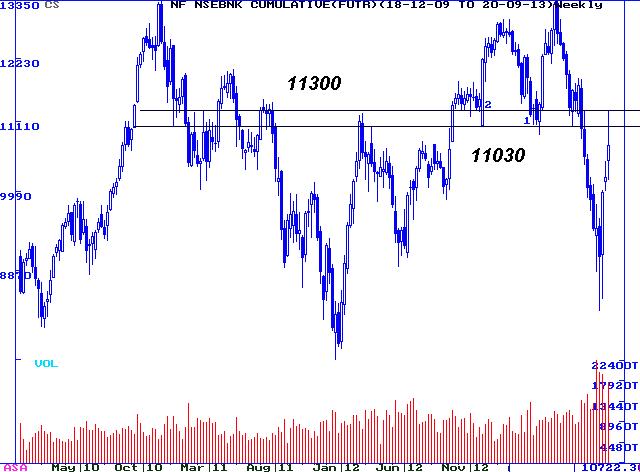
Bank Nifty Futures have formed a flag and a close below 10538 will negate the flag.A close below 10000 will negate the bullishness .
On the Weekly Charts 11030 – 11300 is resistance.

WEEKLY
NIFTY FUTURES (6145.75 ) -108.25 6037.5
I received a lot of mails asking whether markets are bullish after the RBI announcement and what to do.Let me explain a bit if trading strategies.Entries are taken on pull backs of upward breakouts and pull backs to support as “RISK REWARD” ratio is favourable.Vice versa for bearishness.Arbitrary entries do not give a favourable risk – reward ratio.
Now in the current scenario, imagine a person did not take a position because of US FED and RBI policies.What he should do ?..Maybe he can enter on supports if he is bullish or sell on rallies near the all time highs around 6290 – 6348 with that as a stop if he is bearish.But he has to have a “view” on the markets.
In my case, I had given buys at two points namely 5645 and 5889 ( see green points )and trail it.The flag formation is no doubt intact but a close below 5945 negates the flag and long positions have to be liquidated ( not short ).A close below 5706, will end the Uptrend.If market closes below 5945, I will sell the longs and wait for fresh patterns to emerge.
Resistance for the upmoves is at 6209.9 / 6349
On the Weekly Charts, Nifty Futures have formed a spinning top which means markets are not decided on the future direction.
NIFTY DAILY
WEEKLY
BANK NIFTY FUTURES (11214.1) -490.8 10722.3
Bank Nifty Futures have formed a flag and a close below 10538 will negate the flag.A close below 10000 will negate the bullishness .
On the Weekly Charts 11030 – 11300 is resistance.
WEEKLY
DISCLAIMER: These notes/comments have been prepared solely to educate those who are interested in the useful application of Technical Analysis. While due care has been taken in preparing these notes/comments, no responsibility can be or is assumed for any consequences resulting out of acting on them.Trading in Stocks/Commodities/Futures Carry Risk.
NEXT POST ON OCTOBER 1
NIFTY FUTURES (6037.50 ) – 123.1 5914.4
Nifty futures and Bank NIfty Futures have negated the flag. So there are no long positions.Stay aside and wait for higher bottom – higher top formation or lower bottom – lower top formation for fresh positions.Same is the case of Bank Nifty.
BANK NIFTY FUTURES ( 10722.30 ) – 477.85 10244.45
DISCLAIMER: These notes/comments have been prepared solely to educate those who are interested in the useful application of Technical Analysis. While due care has been taken in preparing these notes/comments, no responsibility can be or is assumed for any consequences resulting out of acting on them.Trading in Stocks/Commodities/Futures Carry Risk.
NIFTY FUTURES ( 5914.55 ) -25.55 5889
A change in my itinerary has taken place, as a result of which I am writing earlier than my scheduled date.
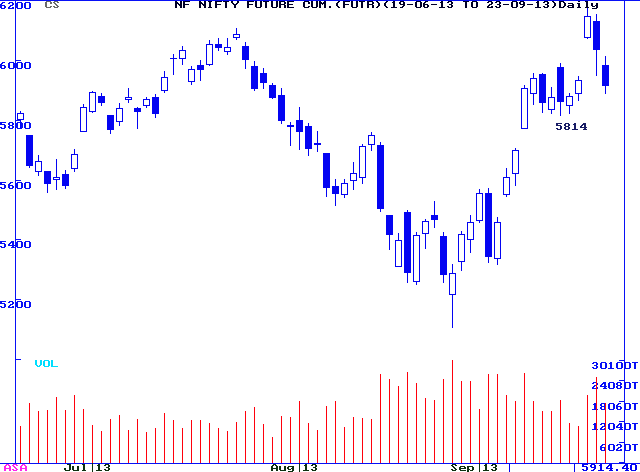
Nifty futures if it stays above 5814, will have made a higher bottom and may go to test the previous top at 6174.80 A close below 5814 will negate the highertop – higherbottom formation.The stops for all longs if taken is a close below 5758 ( 200 dma green line) or 5706.9
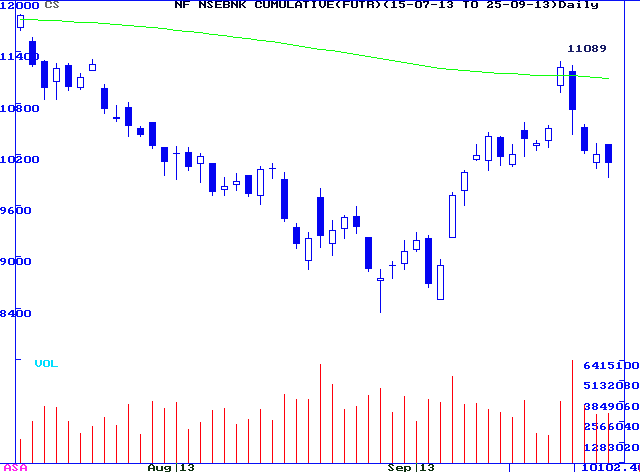
BANK NIFTY FUTURES (10203.40) – 101 10102.4
Bank Nifty Futures is meandering between 200 dma at 11089 and 10000 the stoploss level.Stay away from this Index for the time being.
NIFTY FUTURES ( 5914.55 ) -25.55 5889
A change in my itinerary has taken place, as a result of which I am writing earlier than my scheduled date.
Nifty futures if it stays above 5814, will have made a higher bottom and may go to test the previous top at 6174.80 A close below 5814 will negate the highertop – higherbottom formation.The stops for all longs if taken is a close below 5758 ( 200 dma green line) or 5706.9
BANK NIFTY FUTURES (10203.40) – 101 10102.4
Bank Nifty Futures is meandering between 200 dma at 11089 and 10000 the stoploss level.Stay away from this Index for the time being.
DISCLAIMER: These notes/comments have been prepared solely to educate those who are interested in the useful application of Technical Analysis. While due care has been taken in preparing these notes/comments, no responsibility can be or is assumed for any consequences resulting out of acting on them.Trading in Stocks/Commodities/Futures Carry Risk.
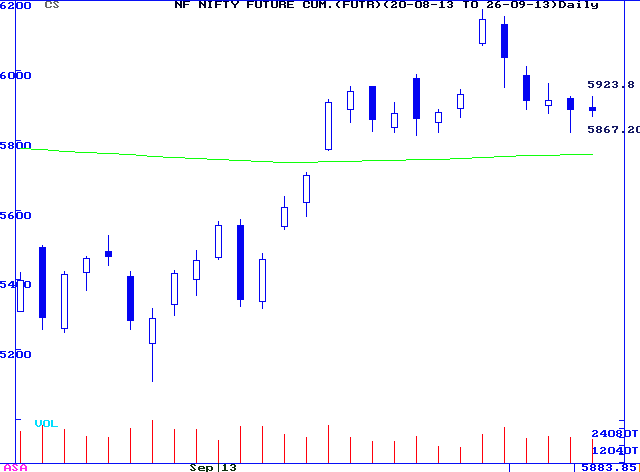
NIFTY FUTURES 5883.85 -5.15 (5889)
Nifty Futures have made a “HArami CRoss” Candle pattern which is equivalent to Inside day and NR7 pattern as per western technicals.Look for buy above 5924 ( stoploss at 5867.20 ) and sell below 5867 ( stoploss at 5924) . 33 % of the time it may trigger on both sides. 200 day Moving average is at 5758.
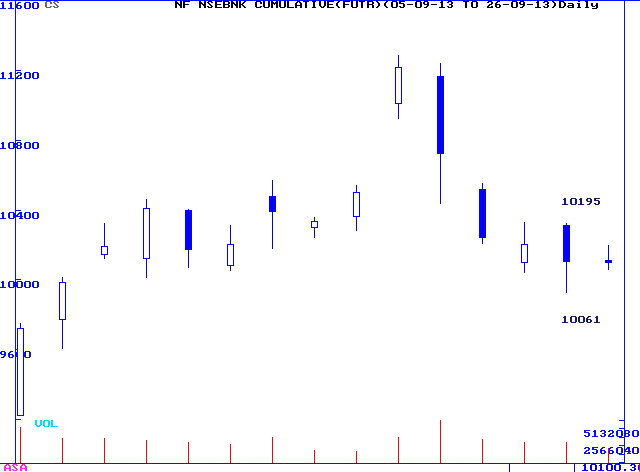
BANK NIFTY FUTURES 10100.3 – 2.10 (10102.4)
Bank Nifty Futures have made a “HArami CRoss” which is similar to Inside day and NR7 .This is more powerful than NIfty .Buy above 10195 ( stop below 10061) and sell below 10061 ( stop above 10195).
NIFTY FUTURES 5883.85 -5.15 (5889)
Nifty Futures have made a “HArami CRoss” Candle pattern which is equivalent to Inside day and NR7 pattern as per western technicals.Look for buy above 5924 ( stoploss at 5867.20 ) and sell below 5867 ( stoploss at 5924) . 33 % of the time it may trigger on both sides. 200 day Moving average is at 5758.
BANK NIFTY FUTURES 10100.3 – 2.10 (10102.4)
Bank Nifty Futures have made a “HArami CRoss” which is similar to Inside day and NR7 .This is more powerful than NIfty .Buy above 10195 ( stop below 10061) and sell below 10061 ( stop above 10195).
Last edited:
DISCLAIMER: These notes/comments have been prepared solely to educate those who are interested in the useful application of Technical Analysis. While due care has been taken in preparing these notes/comments, no responsibility can be or is assumed for any consequences resulting out of acting on them.Trading in Stocks/Commodities/Futures Carry Risk
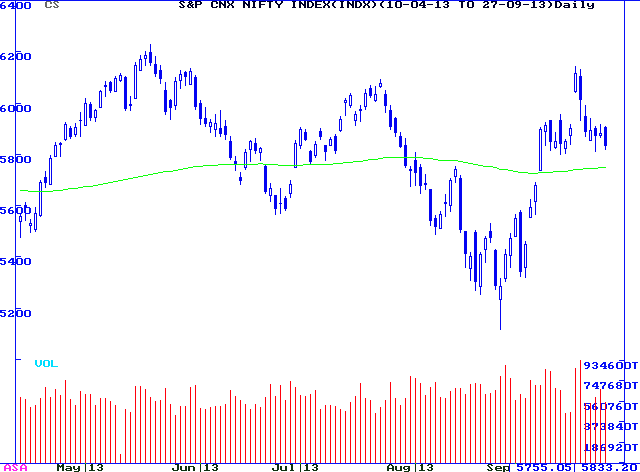
NIFTY SPOT (5882.25) – 49.05 5833.2
Right now I am giving NiftySpot Charts.On Friday I had said, after rectifying my mistake, that a move below 5864.1 can be sold short and NIfty fell after it broke below that level .Right now Nifty is above 200 dma at 5748.74 .A close below 5748.74 for 3 consecutive days will be bearish. Last support for NIfty is at 5688.6 So watch these levels carefully.
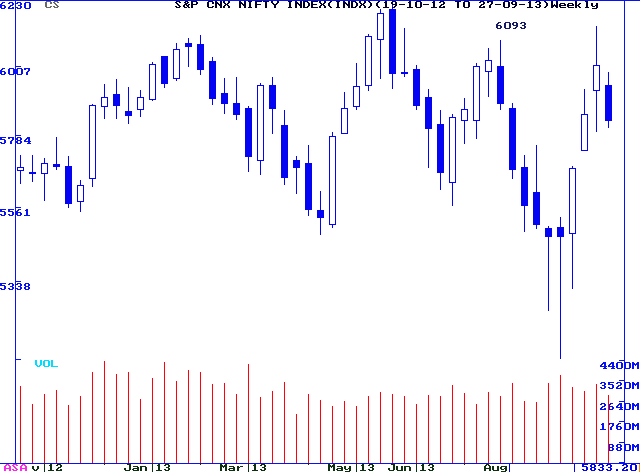
On the Weekly chart, Nifty could not close above the right shoulder at 6093.35
NIFTY DAILY
WEEKLY
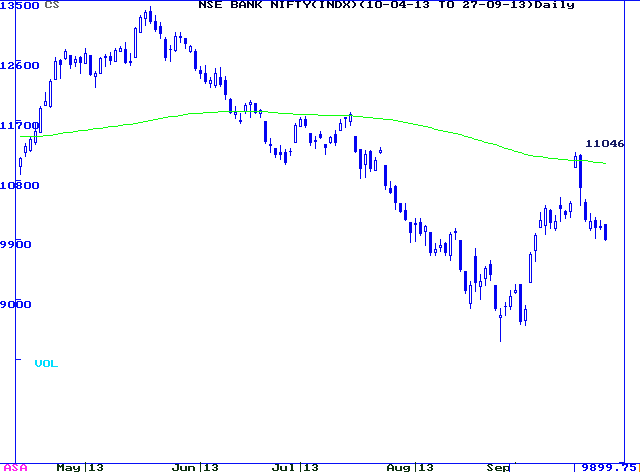
BANK NIFTY (10098.25) – 198.5 11046
Bank Nifty is below the 200 dma at 11046, so is bearish.
NIFTY SPOT (5882.25) – 49.05 5833.2
Right now I am giving NiftySpot Charts.On Friday I had said, after rectifying my mistake, that a move below 5864.1 can be sold short and NIfty fell after it broke below that level .Right now Nifty is above 200 dma at 5748.74 .A close below 5748.74 for 3 consecutive days will be bearish. Last support for NIfty is at 5688.6 So watch these levels carefully.
On the Weekly chart, Nifty could not close above the right shoulder at 6093.35
NIFTY DAILY
WEEKLY
BANK NIFTY (10098.25) – 198.5 11046
Bank Nifty is below the 200 dma at 11046, so is bearish.
| Thread starter | Similar threads | Forum | Replies | Date |
|---|---|---|---|---|
| S | EOD data for Nifty 50 with volume | Introductions | 0 | |
| T | what are the external force which can change Indian nifty moment ? | Equities | 4 | |
| E | Free Practice Account for Indian Nifty Stocks | Day Trading | 2 | |
|
|
Can Indians Trade SGX NIFTY Futures | Futures | 3 | |
| D | NIFTY & Indian Stock views | Equities | 19 |
Similar threads
-
-
what are the external force which can change Indian nifty moment ?
- Started by trade_beginner
- Replies: 4
-
-

-