Nifty and Indian stocks

devadas

Well-Known Member
Disclaimer : These notes/comments have been prepared solely to educate those who are interested in the useful application of Technical Analysis. While due care has been taken in preparing these notes/comments, no responsibility can be or is assumed for any consequences resulting out of acting on them.Trading in Stocks/Commodities/Futures Carry Risk.Consult your financial advisor only before you trade.

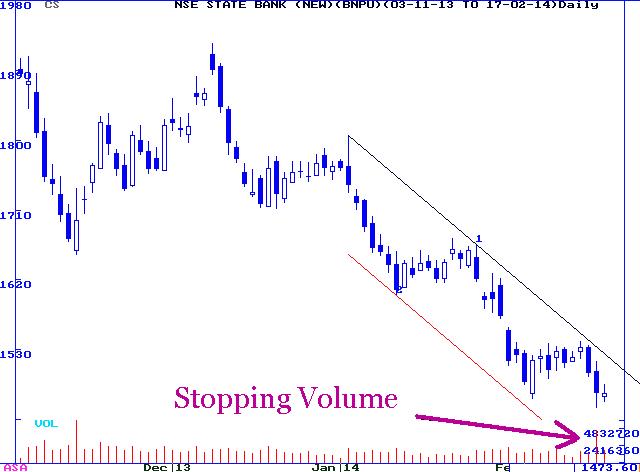
STATE BANK OF INDIA (1473.60)

State Bank of India has made a double bottom, stopping Volumes have supported on Friday and an inside day today.Buy with a stop of 1395, High trading below .If you are risk averse, compromising stop is at 1429 with the high of the bar trading below it.

 
Last edited:

devadas

Well-Known Member
Disclaimer : These notes/comments have been prepared solely to educate those who are interested in the useful application of Technical Analysis. While due care has been taken in preparing these notes/comments, no responsibility can be or is assumed for any consequences resulting out of acting on them.Trading in Stocks/Commodities/Futures Carry Risk.Consult your financial advisor only before you trade.

Nifty Intra SPOT 15 mins

Sell @ 6139

Stop @ 6157.1

Target 6122

CONVERT SPOT TO FUTURES PRICE


devadas

Well-Known Member
Disclaimer : These notes/comments have been prepared solely to educate those who are interested in the useful application of Technical Analysis. While due care has been taken in preparing these notes/comments, no responsibility can be or is assumed for any consequences resulting out of acting on them.Trading in Stocks/Commodities/Futures Carry Risk.Consult your financial advisor only before you trade.

NIFTY AND BANK NIFTY REACHED TARGETS AS PREDICTED ON MARCH 02 in my blog.

NIFTY CHART OF MARCH 02


NIFTY CHART OF MARCH 06 , TODAY


BANK NIFTY FURURES PREDICTION ON MARCH 02


BANK NIFTY FUTURES CHART MARCH 06 ,TODAY


a1b1trader

Well-Known Member
Thanks Devadas

But you did not post the charts of 2.3.14 here in TJ

Though I have seen these charts somewhere else :D

BTW
What is your opinion
If I say
That we can see a correction of say 150-300 points (starting from tomorrow or next week), before any upmove to 6700 or higher to 6900 or so.
 

devadas

Well-Known Member
Thanks Devadas

But you did not post the charts of 2.3.14 here in TJ

Though I have seen these charts somewhere else :D

BTW
What is your opinion
If I say
That we can see a correction of say 150-300 points (starting from tomorrow or next week), before any upmove to 6700 or higher to 6900 or so.

Thanks a1b1 trader.Yes I forgot to post those charts in traderji, that is why I wrote in the heading it was posted in my blog.

Regarding your question, the Nifty is facing resistance, one at the median line and second at the Rectangle top.Both are nearly at the previous highs of 6415.25 approx. If we do not close above 6415.25 for two - three days (use your discretion) we will see correction.Stops for shorts are very near.But if we close above, then we may see Nifty zooming. Let us wait and watch.

But I would not take a short call at this juncture unless I see a powerful reversal candle like Engulfing Red candle or a Doji.
 
Last edited:

devadas

Well-Known Member
NIFTY WEEKLY

Disclaimer : These notes/comments have been prepared solely to educate those who are interested in the useful application of Technical Analysis. While due care has been taken in preparing these notes/comments, no responsibility can be or is assumed for any consequences resulting out of acting on them.Trading in Stocks/Commodities/Futures Carry Risk.Consult your financial advisor only before you trade.

NIFTY WEEKLY SPOT

Nifty as predicted is forming Wave (4).If so, it will go below 7422.So we may take some more time in this range.After the completion of Wave (4), wave (5) upwards will start.Any break and close above 7841, may indicate the start of Wave 5.Also, if the current wave fails to break below 7422 ,we may form a triangle or a complex correction or the (5) th wave has already started.

Track the current, downward wave on Hourly charts.As far as the structure is in “5”, the down move is intact.This is because I am expecting a “C” wave which is a “5”.Any time the market stays above 7841 without breaking 7422, the upward wave has started.The correction currently forming will not be a Simple A-B-C but may be a Sharp correction, a triangle or a Complex correction since it has to alternate with Wave(2).

For a Novice who cannot make head or tail of Elliott Wave, watch the 7841 level on Weekly closing basis.Below it, Nifty is sideways to bearish .Above it Nifty is bullish.Also atleast one “Up” leg is pending after this correction so don’t be overly bearish.

NIFTY WEEKLY SPOT ( Click on Chart )


devadas

Well-Known Member
Disclaimer : These notes/comments have been prepared solely to educate those who are interested in the useful application of Technical Analysis. While due care has been taken in preparing these notes/comments, no responsibility can be or is assumed for any consequences resulting out of acting on them.Trading in Stocks/Commodities/Futures Carry Risk.Consult your financial advisor only before you trade

NIFTY DAILY SPOT

On August 03, I showed Weekly Nifty, where I said that wave 4 is forming.I am giving the internal structure of wave 4 if indeed that is forming.This is a daily chart for more clarity.Keep appropriate stoplosses.

Click on Chart


devadas

Well-Known Member
NIFTY

As mentioned in my earlier post of MONTHLY NIFTY , that trend is bearish and we may not see any new highs soon.Nifty is behaving exactly as mentioned.
I am showing the DAILY NIFTY chart below where IF AND ONLY IF the given count is right, i.e if we form 5 th wave as shown in pink letters, we can expect a short bounce or Pullback to 10700 -11100 levels .This 5 th wave completion happens only if we don’t make any new lows on Hourly charts.In other words, if on 24 th Oct we see a gap down opening or a normal opening and NIFTY sustains above the low on Hourly basis and this low is NOT broken on 25 th October also , we may have finished the 5 th wave of Wave 1 Circled in yellow.Only under these conditions we can expect a bounce.Also the 5 th wave completion can happen on any day even after 25 th also.So use your technical tools to confirm a bottom.The rally if it takes place is only a Pullback rally and not a Bull Market rally.
The BREAK of BLUE trendline drawn across points 2 and 4 on the chart is another way to confirm the completion of wave 5 of circled 1.But it will be very high e.g Oct 24 th value is 10586 , Oct 25 th is 10533 etc.A series of higher high-higher lows on Hourly charts also can be used as confirmation of completion of Wave 5 of circled 1.
Look for strong resistance at 10436, 10754-10843 areas if at all a bounce back happens.
But the overall monthly trend is down.
But if we make New LOWS every day or even once in 3 days this view does not hold.


NIFTY.png


Note by Moderator : Devadas, you are a valued member of this forum, but please don't post the link to your personal blog here.
 
Last edited by a moderator:

Similar threads