Nifty and Indian stocks

devadas

Well-Known Member
Disclaimer : These notes/comments have been prepared solely to educate those who are interested in the useful application of Technical Analysis. While due care has been taken in preparing these notes/comments, no responsibility can be or is assumed for any consequences resulting out of acting on them.Trading in Stocks/Commodities/Futures Carry Risk.Consult your financial advisor only before you trade.

CNX NIFTY ( 6,274.25) + 107.60 + 1.74 %

Nifty last week made a “Thrusting” candlestick pattern which is so called since it could not close above the halfway mark i.e 6292 of the black bearish engulfing Candle. .Thrusting pattern is actually a bearish pattern and selling will start once the low i.e 6129 is broken.For Nifty to be bullish it must close above 6416 on a weekly basis or should not close below 6129.


WEEKLY BANK NIFTY 11,292.35 + 204.90 +1.85 %

Weekly Bank Nifty has formed a spinning top.A spinning top at this level cannot be construed as bullish or bearish as it is a pattern of indecision.For longs stop loss is at a level of 11040 and for shorts it is at 12226 on a Weekly close basis.


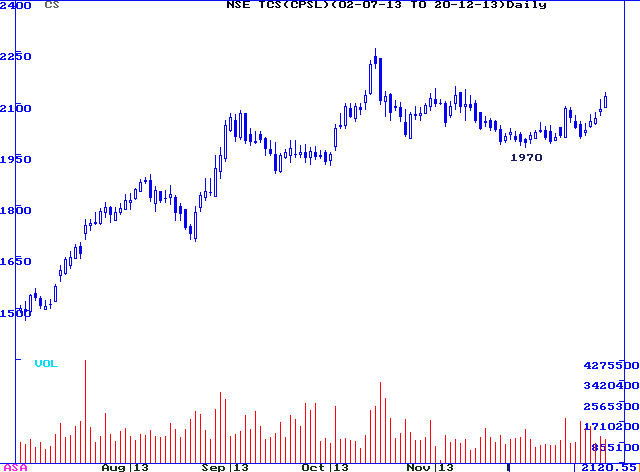
TCS DAILY 2120.55

TCS has formed a bullish Saucer pattern.Stop loss is close below 1970.
 

devadas

Well-Known Member
Disclaimer : These notes/comments have been prepared solely to educate those who are interested in the useful application of Technical Analysis. While due care has been taken in preparing these notes/comments, no responsibility can be or is assumed for any consequences resulting out of acting on them.Trading in Stocks/Commodities/Futures Carry Risk.Consult your financial advisor only before you trade.

CNX NIFTY WEEKLY


BANK NIFTY WEEKLY


Since Nifty and Bank Nifty are giving mild downward to sideways trend , I feel it is better to avoid them till results start pouring in and a clear trend emerges.

Markets will be sector specific with IT and Pharma sector doing well.I am giving below some specific scrips.

Last Week’s recommendation i.e TCS rocked


TCS


TCS still looks good for holding, move the stop to 2090 .If market collapses, book partial profits


AXIS BANK


Personally I have never been bullish on the banking stocks.But this scrip looks good since it is above the 200 dma.Can buy on corrections with a close below 200 dma of 1195 as stop.


LUPIN

As far as Lupin stays above 925, it is bullish.Stop is a close below 896.


PVR

High risk involved.Stop at 557.Stop loss is very far, so may be buy on dips.


a1b1trader

Well-Known Member
Hi Devadas

After a long time. :)

But you will notice that in weekly and daily chart NIFTY is taking support on the rising trendline. And last week it closed just above the support line

And so IMO there is no danger till it closes above the support line.
 

devadas

Well-Known Member
Hi Devadas

After a long time. :)

But you will notice that in weekly and daily chart NIFTY is taking support on the rising trendline. And last week it closed just above the support line

And so IMO there is no danger till it closes above the support line.
Hi a1b1 trader Nice of you.Yes, that why I said, Nifty is "mildly bearish to sideways."Point is 2-3 bearish candles are not good.Will wait and watch.

Your view is well taken.Thanks for the comment.

Warm Regards
 
Hi Devadas

After a long time. :)

But you will notice that in weekly and daily chart NIFTY is taking support on the rising trendline. And last week it closed just above the support line

And so IMO there is no danger till it closes above the support line.
your point would have been better understood if accompanied with a chart :clap:
 

devadas

Well-Known Member
NIFTY INTRA DAY
13 Feb

Disclaimer : These notes/comments have been prepared solely to educate those who are interested in the useful application of Technical Analysis. While due care has been taken in preparing these notes/comments, no responsibility can be or is assumed for any consequences resulting out of acting on them.Trading in Stocks/Commodities/Futures Carry Risk.Consult your financial advisor only before you trade.

CNX NIFTY 6,001.10 -82.90 -1.36 %

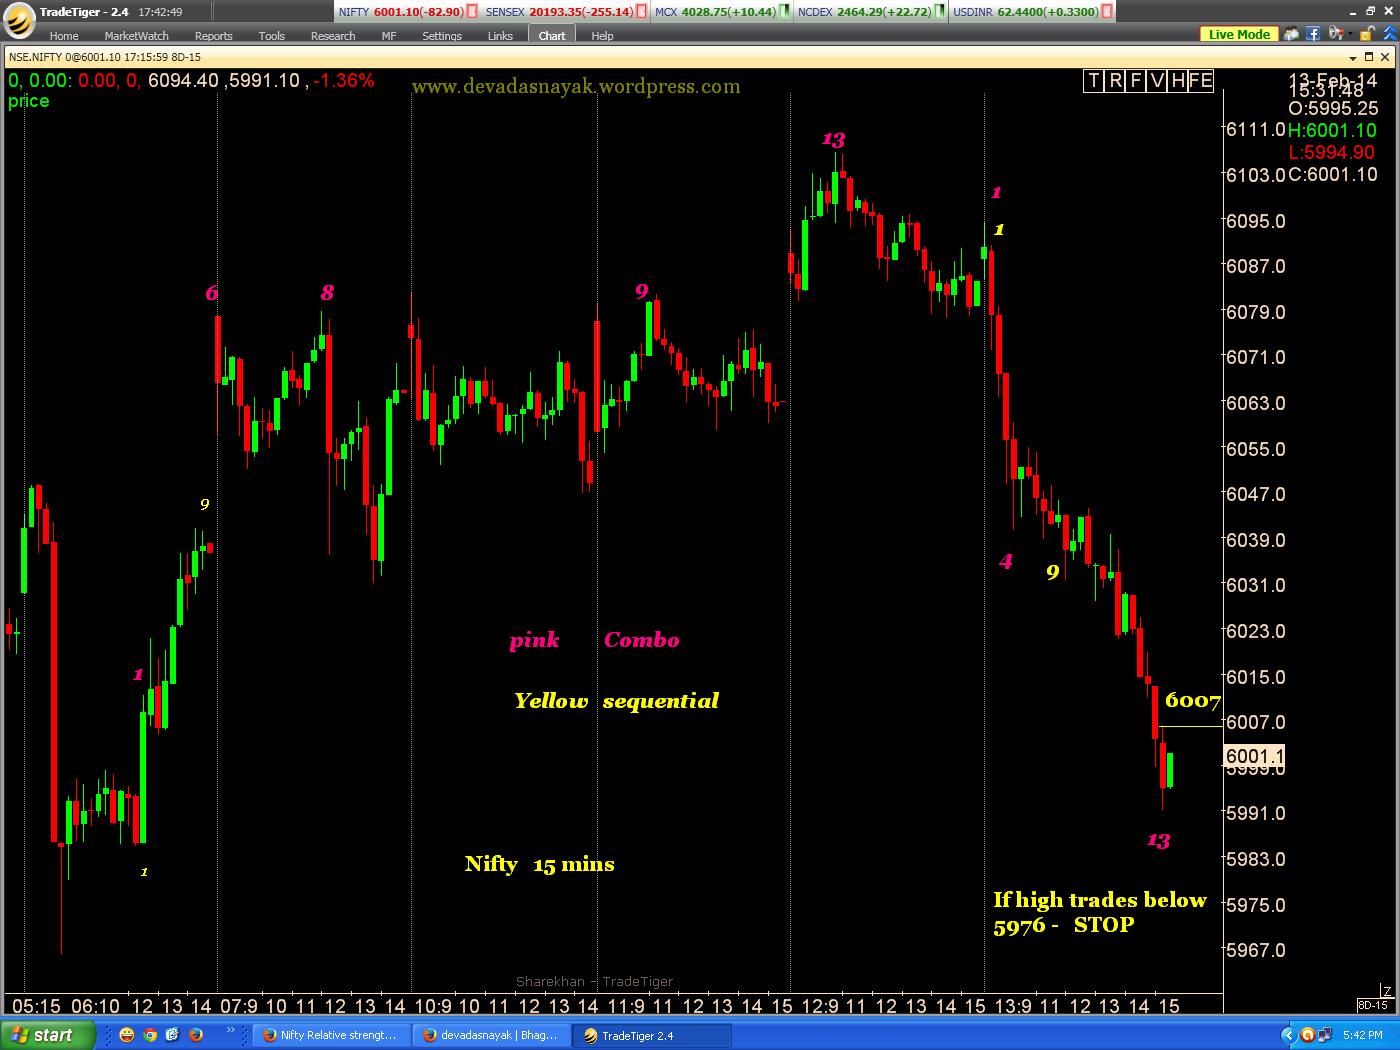
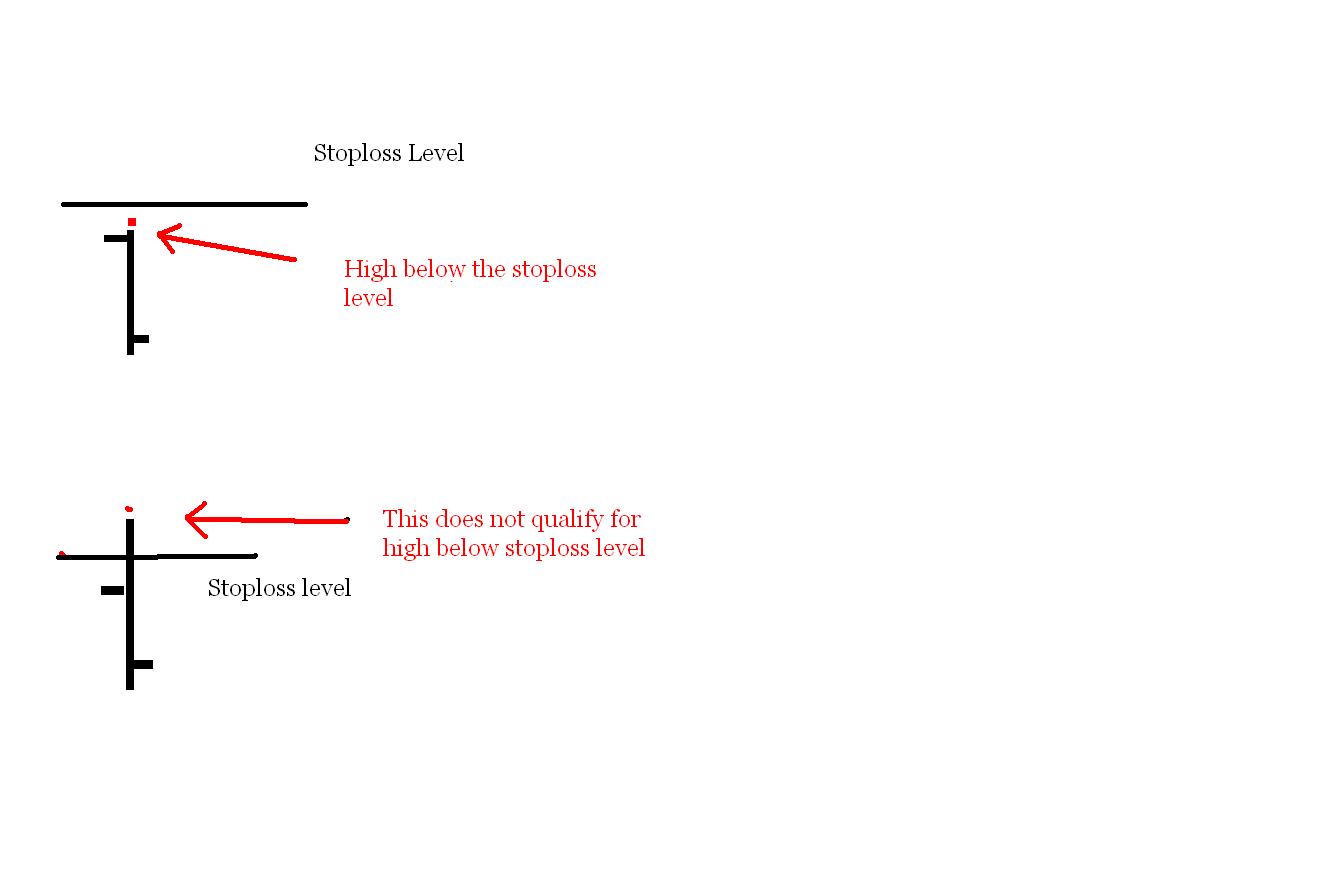
Nifty 15 min chart is depicted below.It has completed a TD Combo 13sell signal on 15 minute chart, which was the reason of fall today.Also it has completed a buy setup and TD Combo buy.One can go long above 6007, provided the high of 15 minute bar is not below 5976.(Warning : I am discussing about 15 min bar / candle and not daily high / low One should use Live charts while trading these setups).Also this is only for intra day trading.
If market opens lower and then crosses 6007 and the high of any 15 min bar ( after it crosses 6007) does not go below, 5976 then it is a valid signal.The moment any 15 min bar high goes below 5976, then stop is triggered.
Do not try this system if you are not well versed with the above mentioned terminology and chart markings.

NIFTY 15 minute Chart


Last edited:

devadas

Well-Known Member
Disclaimer : These notes/comments have been prepared solely to educate those who are interested in the useful application of Technical Analysis. While due care has been taken in preparing these notes/comments, no responsibility can be or is assumed for any consequences resulting out of acting on them.Trading in Stocks/Commodities/Futures Carry Risk.Consult your financial advisor only before you trade


Similar threads