Re: Filters
Now I am telling here my first simplest trading system, based on 21 days MAs.
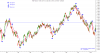
Take positions according to 21 days EMA alongwith price line (in 5 minutes chart).
Trading rules :
1. Buy when first time bar or candle closing above 21 days EMA. Keeping SL of previous Pivot Low .
2. Sell when first time bar or candle closing below High 21 days EMA. Keeping SL of previous Pivot Low.
3. While considering pivots low or high, price difference should be greater or lesser than 15% for pivot high or low respectively.
4. Neglect EMA crossover in between trade, means when in positions avoid fresh buy or sell signal based on MAs until SL is getting hits.
5. Fresh trade/Reverse ur positions once SL getting triggered.
Chart attached for better understanding.
Please help me in understanding this. I am taking a Long for example.
The candle must close above 21EMA on 5 min chart for taking a Long.
When we enter the long, our SL wil be last pivot Low on 5 min chart.
Now we dont enter or exit the position when prices and EMAs crossover.
We simply keep updating our SL to higher PLs.
Now, when the SL is hit, do we SAR immediately or do we wait for a price closing below 21 EMA for a short entry?
Also, do we add? If yes, how and when?
Price below 500 - 0.5%
Price above 500 - 0.30%
I didnt understand dese figures..cud u explain please?