


Day Trading Stocks & Futures
- Thread starter TraderRavi
- Start date
- Tags banknifty bnf daytrading nifty future
")
2019-The Year of the Bear Market
January 2018- Global Synchronized Market Top
A global top is what we witnessed at the beginning of this year and the down side off of the top is now playing out in according to the script of a PBC(post bubble contraction ). Unlike the financial crisis of 2008 which started in the USA and impulsed outward, a PBC(post bubble contraction ) begins at the periphery of the world’s economy and is then transmitted towards the core of the senior reserve economy which is the USA. It has always been this way even since ancient times. The Roman historian Cicero stated that a financial disturbance in the outlying regions eventually arrives in Rome affecting the credit structures of the financial center. Those of us in North America seemingly have been immune to this all year…until now. The PBC has now arrived at the doorstep of the world’s financial system and it is now knocking at the door to come in. If one cared to watch you could see it coming all year, but if you just watched CNBC you just got blind sided.
The outer periphery unravels sending capital fleeing to the center
Frontier and emerging markets have been getting destroyed all year long. There has been no place to hide for these investors. Home based equities have been crushed, bond markets have tanked, even cash held in savings has not been a haven since emerging currencies have relentlessly sold off. If you stayed home in any local market sector you got killed…period. So money fled and flowed towards the financial center and that’s why North America has seemed just fine, in fact booming…until now.
World’s Stock Markets minus USA:
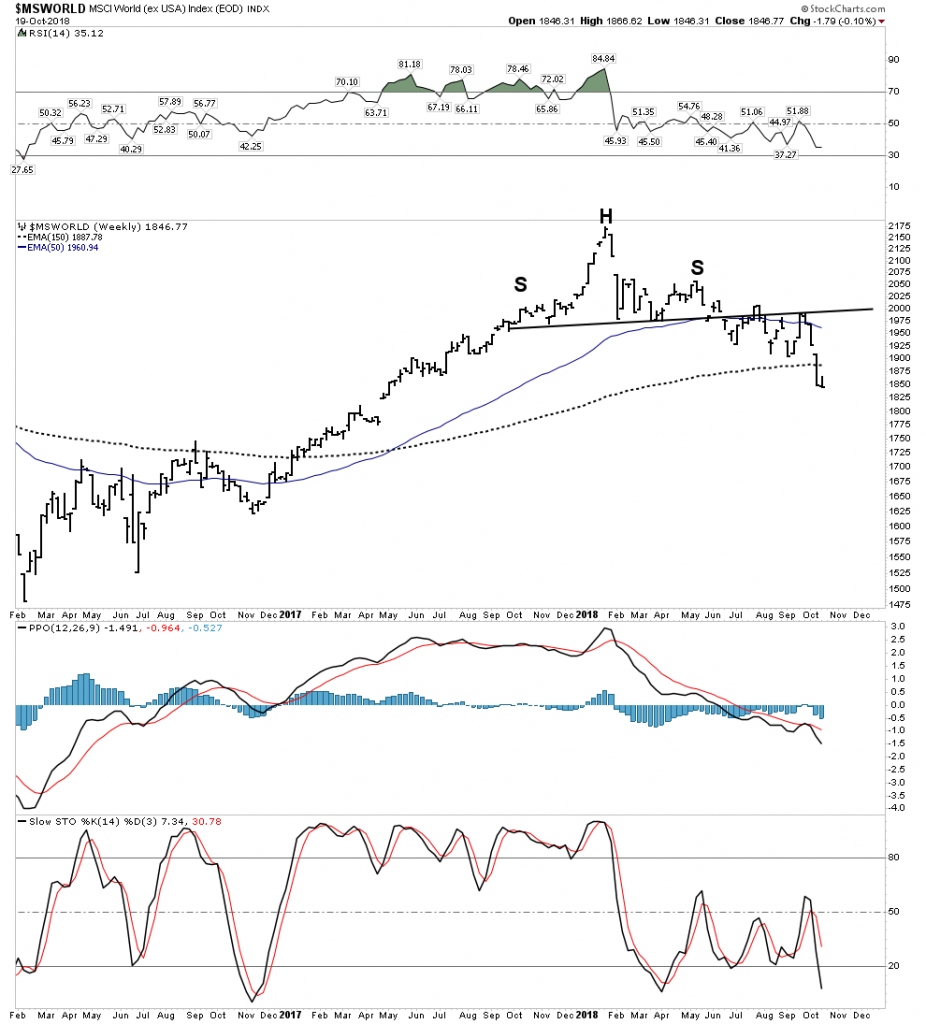
Clearly the aggregate of all of the world’s stock markets minus the USA are now entrenched in a confirmed downtrend, I would argue a bear market. It has taken on the form of a year long broad H&S top which has now broken down beneath a rolling over 30 W EMA. This chart says the bears have now got the ball and with capital now flowing away from the outer regions I don’t see the bulls taking back the ball.
Below is a closer up daily view of the MSWorld:

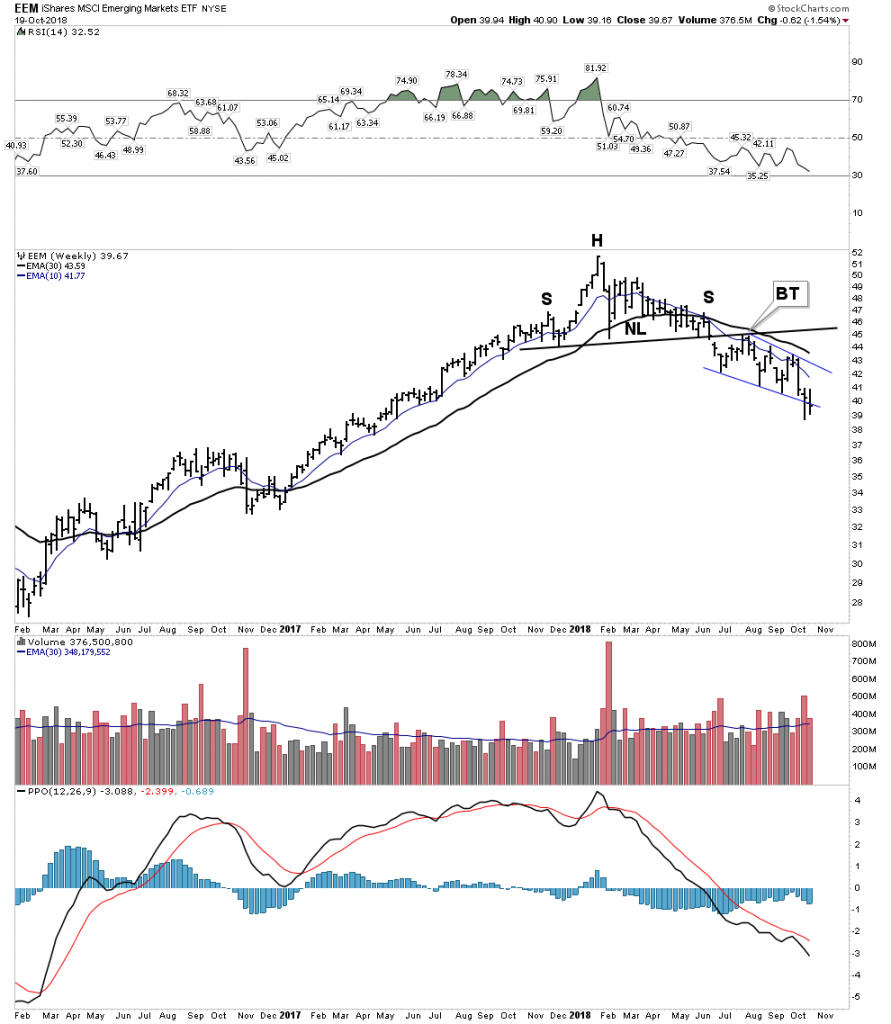
Emerging Markets-A Broad H&S Top ready to accelerate downward
Below we see all the elements of a classic well defined top. A H&S topping pattern with moving averages rolling over and becoming entrenched downward. Higher volume bars are the red down bars. There has been no sign of life here since the blow off January top:
Dow Jones Global Index– All the stock markets of the world
Now we put the USA back into the mix to see what all the stock markets in the world look like. What we see is a massive distribution top which has now broken down under a now declining 30 W EMA. What this chart is saying is it’s now GAME OVER.
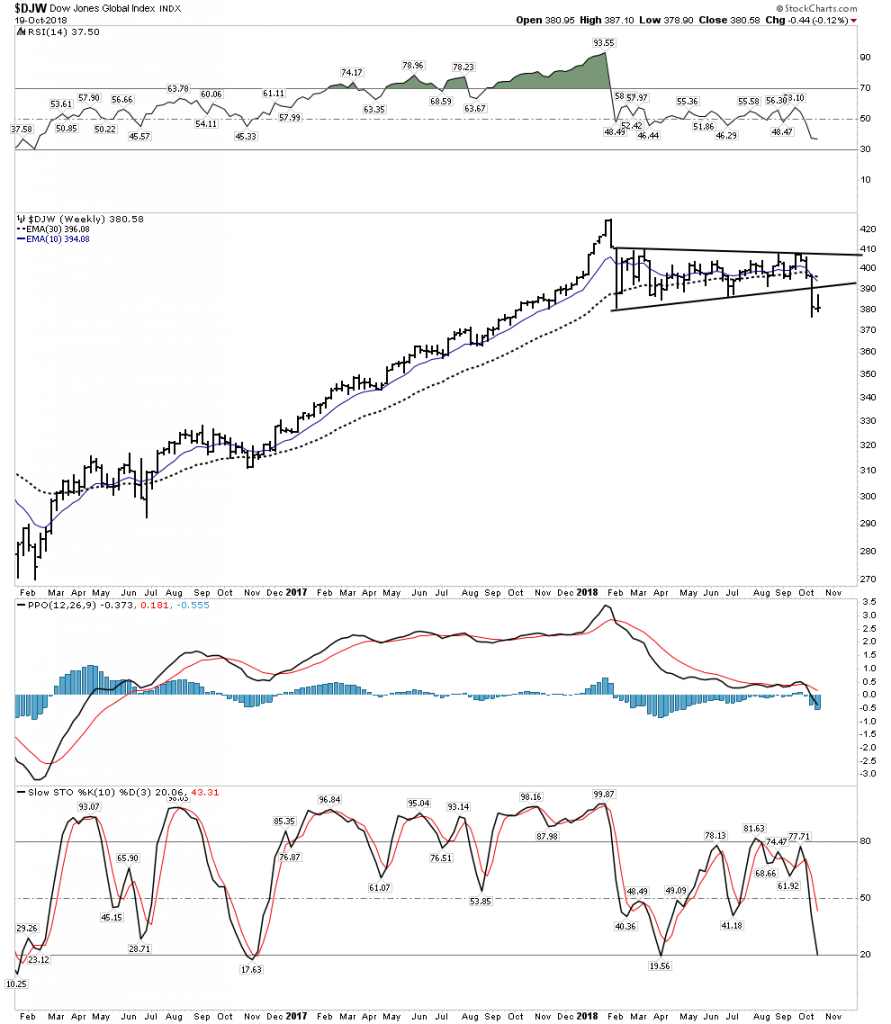
Sure we can expect a back test to the underside of this distribution triangle, which could take the form of a year end rally, but after that and likely when 2019 arrives it’s bombs away. Welcome to the global bear market of 2019.
Tenants of a Post Bubble Contraction
Let’s review the basic tenants of a PBC, refocusing on the big picture.
The last PBC visibly began in 1929 and ended in the late 1940’s. I say visibly because it actually started to take form in 1926 when the real estate market peaked in Florida and the British economy failed to respond to economic stimulus from the US Federal Reserve. These early symptoms were masked by the stock market blow off which continued into September 1929. Debt began to contract in late 1928, however the stock market had gained a life of its own and was undergoing a massive overthrow top. The world’s economy was bloated with unproductive and unserviceable debt which had been building since the bond funding of WWI which began 15 years earlier. Emerging market debt structures initially began to implode, as we see today, and eventually these forces were transmitted to the core in late 1929 kicking off what is known as the “great depression”.
The PBC of 1873 began with the stock market crash of September 1873 and lasted for the next 20 years. It was caused again by a massive debt build up from railroad construction and from the financial abuses during the US’s War for Southern Independence ending in 1865. Building parallel railroads to nowhere using bond issuance was not sustainable and led to the financial collapse under the Grant Administration.
Commodities Peak 8-9 years prior to ALL PBC’s
In all previous 5 recorded PBC’s commodity prices peaked 8-9 years prior to the final peak in equities. Our current PBC is no different as the world wide commodity peak occurred in mid 2008, nine years before the global synchronous top. This same sequence occurred in all 5 previous PBC’s.
Long Term Government Bonds should continue to trend higher
LT government interest rates are presently in an uptrend, however rates should turn down once the recession takes hold since the economy will no longer be able to sustain elevated rates. Government bonds therefore should progress to new all time highs with rates probing new lows in the coming years. This is hard for many to accept since FED “money printing” would seem to debase the bonds leading to higher rates, but that’s not what the PBC model calls for. In Japan after their 1989 peak JGBs continued to rally for 15 years despite the most radical money printing regime in modern times.

January 2018- Global Synchronized Market Top
A global top is what we witnessed at the beginning of this year and the down side off of the top is now playing out in according to the script of a PBC(post bubble contraction ). Unlike the financial crisis of 2008 which started in the USA and impulsed outward, a PBC(post bubble contraction ) begins at the periphery of the world’s economy and is then transmitted towards the core of the senior reserve economy which is the USA. It has always been this way even since ancient times. The Roman historian Cicero stated that a financial disturbance in the outlying regions eventually arrives in Rome affecting the credit structures of the financial center. Those of us in North America seemingly have been immune to this all year…until now. The PBC has now arrived at the doorstep of the world’s financial system and it is now knocking at the door to come in. If one cared to watch you could see it coming all year, but if you just watched CNBC you just got blind sided.
The outer periphery unravels sending capital fleeing to the center
Frontier and emerging markets have been getting destroyed all year long. There has been no place to hide for these investors. Home based equities have been crushed, bond markets have tanked, even cash held in savings has not been a haven since emerging currencies have relentlessly sold off. If you stayed home in any local market sector you got killed…period. So money fled and flowed towards the financial center and that’s why North America has seemed just fine, in fact booming…until now.
World’s Stock Markets minus USA:
Clearly the aggregate of all of the world’s stock markets minus the USA are now entrenched in a confirmed downtrend, I would argue a bear market. It has taken on the form of a year long broad H&S top which has now broken down beneath a rolling over 30 W EMA. This chart says the bears have now got the ball and with capital now flowing away from the outer regions I don’t see the bulls taking back the ball.
Below is a closer up daily view of the MSWorld:
Emerging Markets-A Broad H&S Top ready to accelerate downward
Below we see all the elements of a classic well defined top. A H&S topping pattern with moving averages rolling over and becoming entrenched downward. Higher volume bars are the red down bars. There has been no sign of life here since the blow off January top:
Dow Jones Global Index– All the stock markets of the world
Now we put the USA back into the mix to see what all the stock markets in the world look like. What we see is a massive distribution top which has now broken down under a now declining 30 W EMA. What this chart is saying is it’s now GAME OVER.
Sure we can expect a back test to the underside of this distribution triangle, which could take the form of a year end rally, but after that and likely when 2019 arrives it’s bombs away. Welcome to the global bear market of 2019.
Tenants of a Post Bubble Contraction
Let’s review the basic tenants of a PBC, refocusing on the big picture.
- There have been 5 complete PBC’s since the late 1600’s
- A PBC comes at the end of a credit cycle which typically spans 50-70 years
- A PBC is the markets way to reset an economy by purging high debt levels from the system through bankruptcy, debt restructuring and debt payoff.
- Once the process completes an economy can resume rapid growth rates since there is no longer an oppressive debt overhang impeding growth.
- The PBC process typically takes 15-20 years and is very painful and typically sloppy.
- Societal institutions undergo radical change due to the trauma of debt restructuring.
The last PBC visibly began in 1929 and ended in the late 1940’s. I say visibly because it actually started to take form in 1926 when the real estate market peaked in Florida and the British economy failed to respond to economic stimulus from the US Federal Reserve. These early symptoms were masked by the stock market blow off which continued into September 1929. Debt began to contract in late 1928, however the stock market had gained a life of its own and was undergoing a massive overthrow top. The world’s economy was bloated with unproductive and unserviceable debt which had been building since the bond funding of WWI which began 15 years earlier. Emerging market debt structures initially began to implode, as we see today, and eventually these forces were transmitted to the core in late 1929 kicking off what is known as the “great depression”.
The PBC of 1873 began with the stock market crash of September 1873 and lasted for the next 20 years. It was caused again by a massive debt build up from railroad construction and from the financial abuses during the US’s War for Southern Independence ending in 1865. Building parallel railroads to nowhere using bond issuance was not sustainable and led to the financial collapse under the Grant Administration.
Commodities Peak 8-9 years prior to ALL PBC’s
In all previous 5 recorded PBC’s commodity prices peaked 8-9 years prior to the final peak in equities. Our current PBC is no different as the world wide commodity peak occurred in mid 2008, nine years before the global synchronous top. This same sequence occurred in all 5 previous PBC’s.
Long Term Government Bonds should continue to trend higher
LT government interest rates are presently in an uptrend, however rates should turn down once the recession takes hold since the economy will no longer be able to sustain elevated rates. Government bonds therefore should progress to new all time highs with rates probing new lows in the coming years. This is hard for many to accept since FED “money printing” would seem to debase the bonds leading to higher rates, but that’s not what the PBC model calls for. In Japan after their 1989 peak JGBs continued to rally for 15 years despite the most radical money printing regime in modern times.
The EPIC Bear Market of 2019
The average investor has no idea of the gravity of today’s situation. He will come to appreciate it in good time however, but it will be too late for him. He is in this situation because he has been conditioned to believe that the FED will ultimately save us. They believe the FED has the tools at their disposal to right the ship. This is tomfoolery pure and simple.
Here is the reality… the era of central banks ability to bubble markets is coming to a close. This ability began with the end of the Bretten Woods monetary regime on August 15, 1971 when they acquired a new “expandable” currency. This bubble power is now in the process of going full circle as its zenith is now behind us. Greenspan’s intervention into the market during the crash of 1987 caused a phased transition in central bank liquidity creation. This liquidity spigot shifted into high gear under Bernanke’s QE policies. This era of rampant accommodation has now run its course and we are on the back side of this 30 year market intervention era.
One can not doubt that Chairman Powell will change course when the market enters a bear market free fall, but the FED will have then lost its credibility and the buyers will not likely return after the initial short covering rally. We will then have to endure a full blown bear market. That is something the USA has not seen since December 1974 at its -70% inflation adjusted bottom from the 1966 highs.
The Good News- Gold in a Bull Market
Just like its always 5 o’clock somewhere, there is always a bull market going on in something. In a PBC it’s time for the gold stocks to shine. This is because as commodities decline in price and the real price of gold rises, the cash flows of gold miners will improve and provide leveraged gains to their stock prices.
When will will this occur? Once the recession takes hold and oil prices begin to decline gold should eventually find a bottom and the gold stocks will enter a bull market. That’s the operating dynamic, but how it actually takes form is unpredictable. As the stock market becomes entrenched in a bear market the FED will ultimately change course and inject liquidity. This event could result in an upward explosion in the gold stocks. Something resembling the blast off in the great August 1982 bull market times ten will likely occur. It will be almost impossible to chase once it launches, it’s rise could be relentless.
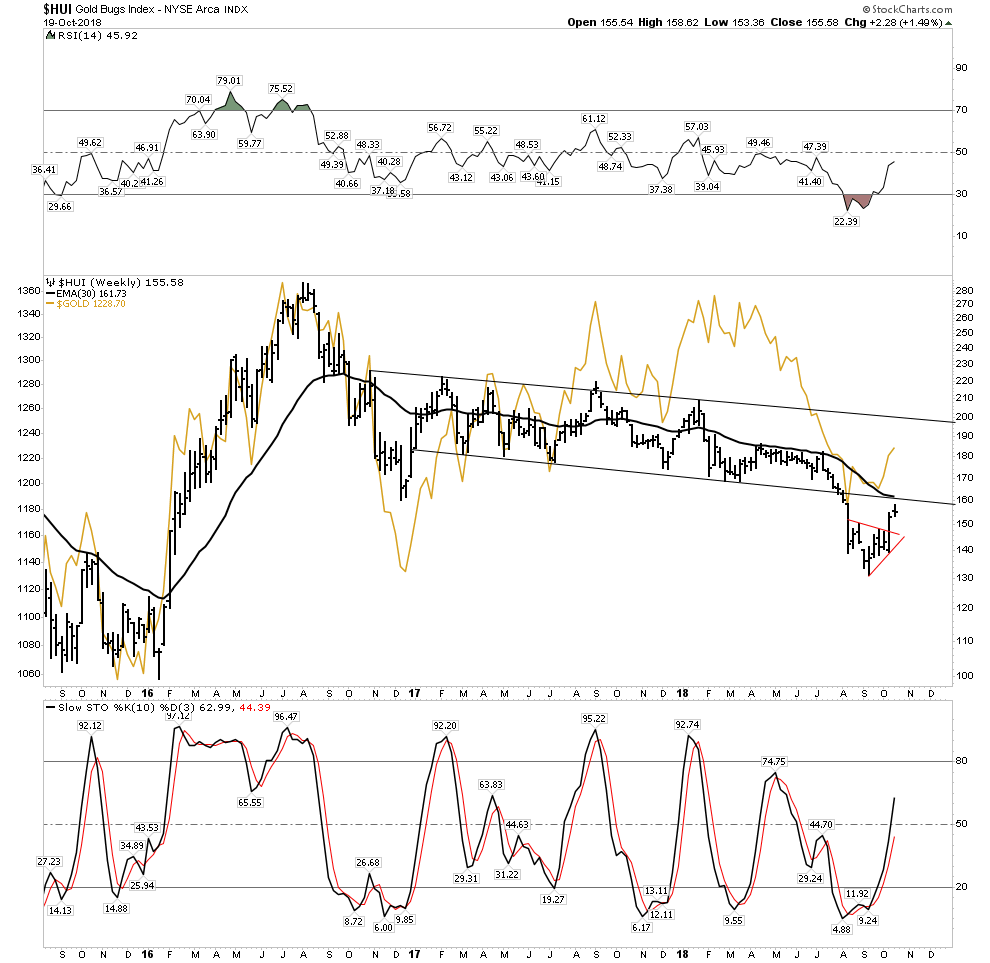
The Current Gold Stock Rally- The Real Deal?
So is this the beginning of the gold bull? No I don’t think just yet. I defer to Rambus’ gold charts, but I see this current rally as a well earned retracement of the prolonged 6 month relentless decline from April to September of this year. In the HUI chart below it appears likely to be in a back test move up to its break down point. The bounce in gold is fairly muted as you can see by the gold line. There is no explosion in volume in the GDX or other individual issues which I expect we will see when the real deal arrives.
Short Squeeze Wild Card
But here is the rub. Gold is sitting on a massive powder keg of TNT. There is so much short interest in gold that if it rises up above 1245 it could take on a life of its own. With over $50B of short interest gold has the potential to rock vertical and in short order, it’s a real possibility. It’s the job of commercial hedgers to sell gold as they have to forward sell in order to collateralize their loans. But here is the thing, they are actually net long! They refuse to sell, this is short term bullish and could lead to a vertical explosion in gold.
I personally don’t want to see this as it would likely flame out once the short squeeze is over and still end up putting in ultimate lower lows before the real bull market begins. Just be aware.
Markets around the world showing their hand
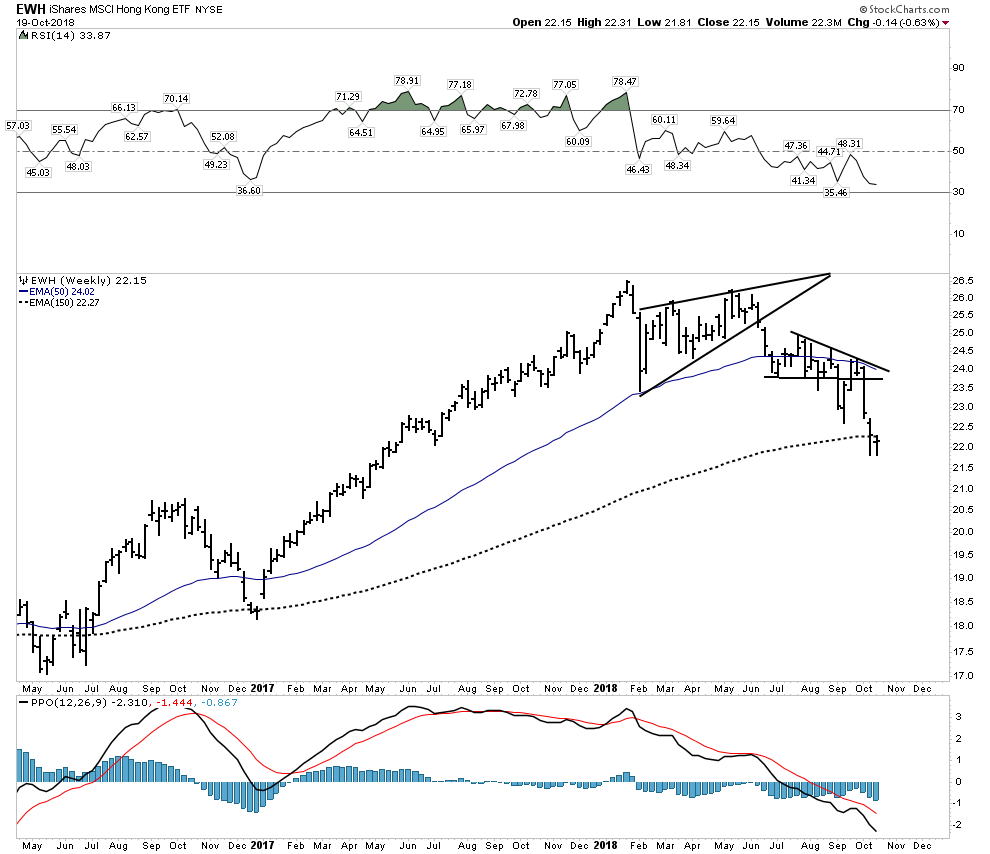
Before discussing strategy let’s update our view of markets around the world, just in case you still don’t believe this really is happening. As mentioned peripheral markets have relentlessly imploded throughout the year and now the decline has advanced to major markets as seen below:
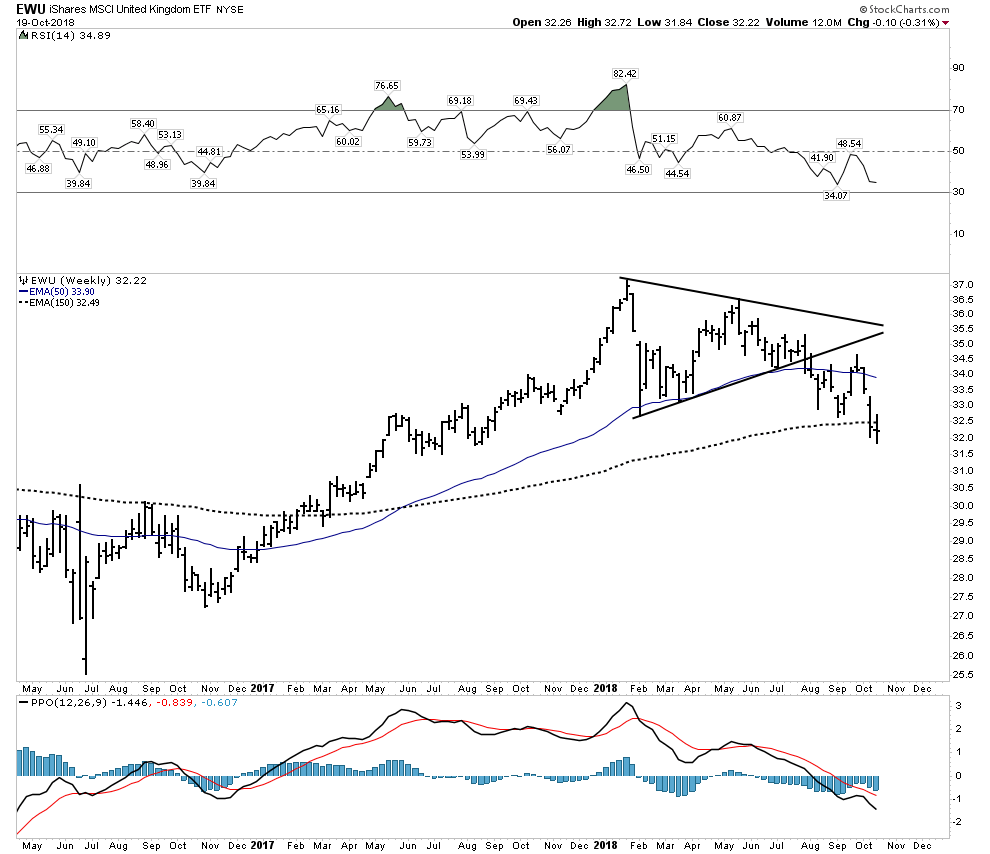
Keep in mind that the UK is a very international senior market and its now below a declining 30 W EMA
Germany– Entrenched decline now below a declining 30 W EMA.

Hong Kong- 7th largest market in the world.
All Pacific-Ex Japan- daily chart

China– The Big Market driving the world’s growth
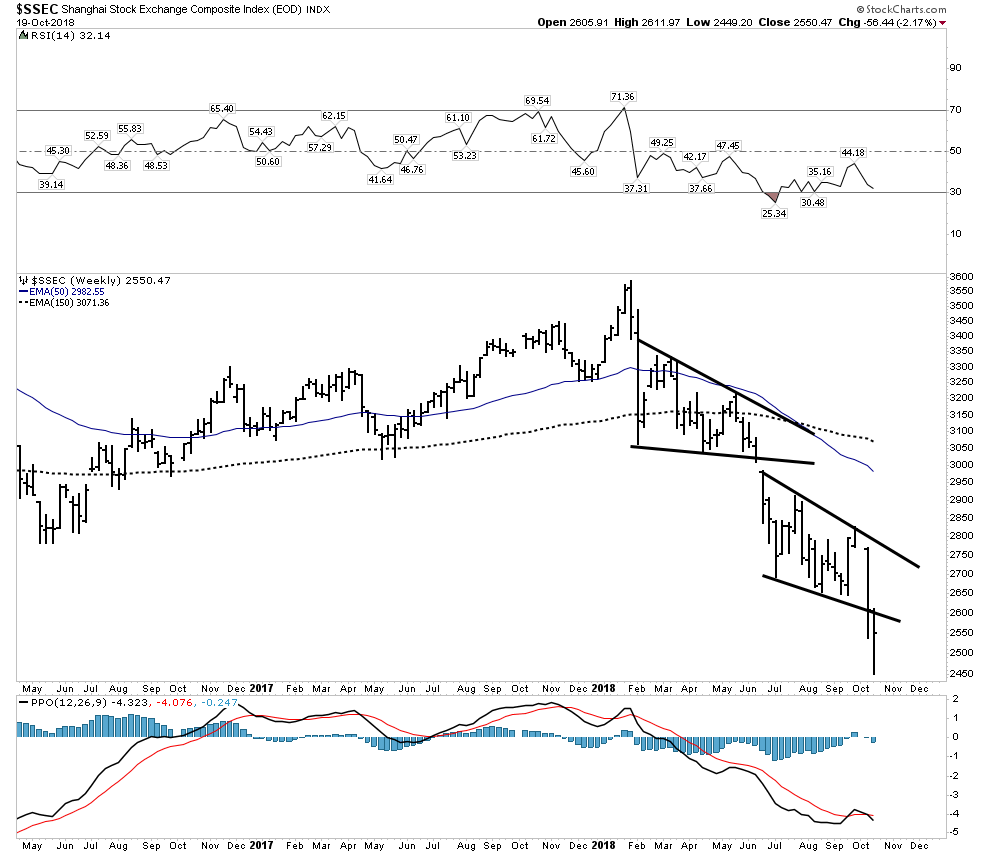
Look again at this chart and think of what it is telling us. It is highly deflationary and distributive. There is simply no sign of life here. The decline this year has been relentless, down 30% this year and 53% off of all time highs. This is signaling a collapse in trade and commodities ahead. Keep in mind that China consumes upwards of 50% of many of the world’s commodities. Plus the government has just lost control of the Yuan, its crashing.
The average investor has no idea of the gravity of today’s situation. He will come to appreciate it in good time however, but it will be too late for him. He is in this situation because he has been conditioned to believe that the FED will ultimately save us. They believe the FED has the tools at their disposal to right the ship. This is tomfoolery pure and simple.
Here is the reality… the era of central banks ability to bubble markets is coming to a close. This ability began with the end of the Bretten Woods monetary regime on August 15, 1971 when they acquired a new “expandable” currency. This bubble power is now in the process of going full circle as its zenith is now behind us. Greenspan’s intervention into the market during the crash of 1987 caused a phased transition in central bank liquidity creation. This liquidity spigot shifted into high gear under Bernanke’s QE policies. This era of rampant accommodation has now run its course and we are on the back side of this 30 year market intervention era.
One can not doubt that Chairman Powell will change course when the market enters a bear market free fall, but the FED will have then lost its credibility and the buyers will not likely return after the initial short covering rally. We will then have to endure a full blown bear market. That is something the USA has not seen since December 1974 at its -70% inflation adjusted bottom from the 1966 highs.
The Good News- Gold in a Bull Market
Just like its always 5 o’clock somewhere, there is always a bull market going on in something. In a PBC it’s time for the gold stocks to shine. This is because as commodities decline in price and the real price of gold rises, the cash flows of gold miners will improve and provide leveraged gains to their stock prices.
When will will this occur? Once the recession takes hold and oil prices begin to decline gold should eventually find a bottom and the gold stocks will enter a bull market. That’s the operating dynamic, but how it actually takes form is unpredictable. As the stock market becomes entrenched in a bear market the FED will ultimately change course and inject liquidity. This event could result in an upward explosion in the gold stocks. Something resembling the blast off in the great August 1982 bull market times ten will likely occur. It will be almost impossible to chase once it launches, it’s rise could be relentless.
The Current Gold Stock Rally- The Real Deal?
So is this the beginning of the gold bull? No I don’t think just yet. I defer to Rambus’ gold charts, but I see this current rally as a well earned retracement of the prolonged 6 month relentless decline from April to September of this year. In the HUI chart below it appears likely to be in a back test move up to its break down point. The bounce in gold is fairly muted as you can see by the gold line. There is no explosion in volume in the GDX or other individual issues which I expect we will see when the real deal arrives.
Short Squeeze Wild Card
But here is the rub. Gold is sitting on a massive powder keg of TNT. There is so much short interest in gold that if it rises up above 1245 it could take on a life of its own. With over $50B of short interest gold has the potential to rock vertical and in short order, it’s a real possibility. It’s the job of commercial hedgers to sell gold as they have to forward sell in order to collateralize their loans. But here is the thing, they are actually net long! They refuse to sell, this is short term bullish and could lead to a vertical explosion in gold.
I personally don’t want to see this as it would likely flame out once the short squeeze is over and still end up putting in ultimate lower lows before the real bull market begins. Just be aware.
Markets around the world showing their hand
Before discussing strategy let’s update our view of markets around the world, just in case you still don’t believe this really is happening. As mentioned peripheral markets have relentlessly imploded throughout the year and now the decline has advanced to major markets as seen below:
Keep in mind that the UK is a very international senior market and its now below a declining 30 W EMA
Germany– Entrenched decline now below a declining 30 W EMA.
Hong Kong- 7th largest market in the world.
All Pacific-Ex Japan- daily chart
China– The Big Market driving the world’s growth
Look again at this chart and think of what it is telling us. It is highly deflationary and distributive. There is simply no sign of life here. The decline this year has been relentless, down 30% this year and 53% off of all time highs. This is signaling a collapse in trade and commodities ahead. Keep in mind that China consumes upwards of 50% of many of the world’s commodities. Plus the government has just lost control of the Yuan, its crashing.
The USA- Just now starting to recognize the story
So all year long the world’s markets have been bleeding out, but the USA has not felt it, but that’s all changed over the past 2 weeks and we are now starting to see what it feels like when liquidity starts to get drained from the system. Look at these two leading interest rate sensitive sectors: autos and builders.
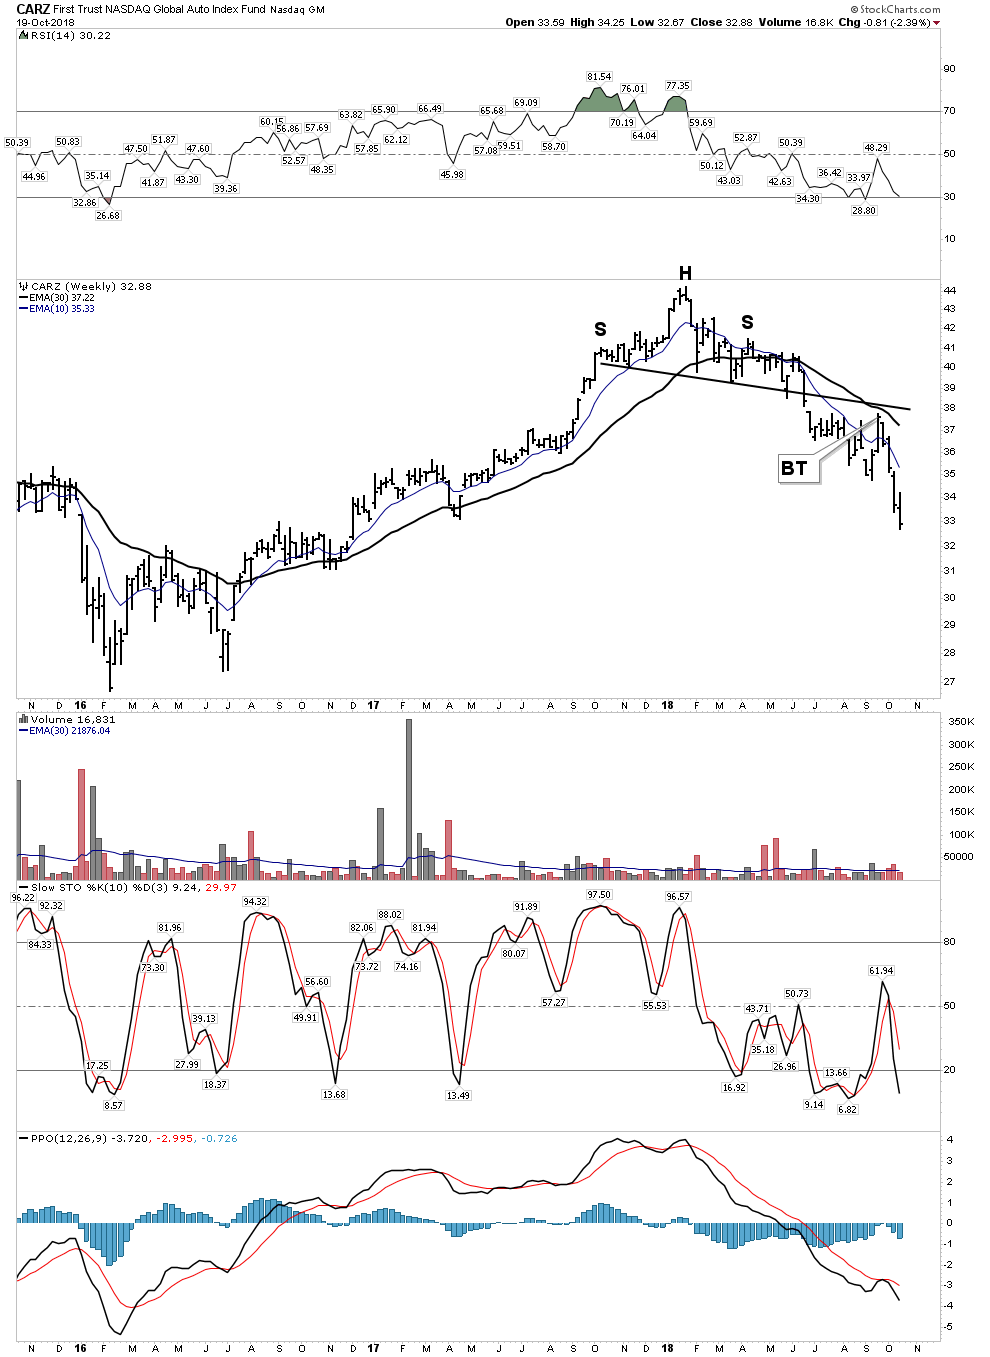
The Home Builders– Brutally Relentless

These are sectors that drive the economy, these two charts are showing the market discounting weakness ahead.
State of the US Markets- At a precipice?
I would say it’s getting close, but not starting the big decline yet, hence the title “The Bear Market of 2019”. Let’s review my hedge fund exit indicator which shows the spread between the 10 and 2 year treasury. You no doubt have heard that the economy goes into recession when the yield curve inverts. Well there are plenty of cases where the economy went into recession without the curve actually inverting, just slightly flattening. So this old saw is an unreliable indicator. What isreliable is when short rates begin to drop after they have been rising in a mature cycle. That’s because it’s saying the jig is up and the economy can no longer support higher short term rates. This is the signal that hedge fund managers who have over stayed themselves in this market are looking for to exit the market. We can see this occurring now in the below chart signaled by the spread rising.
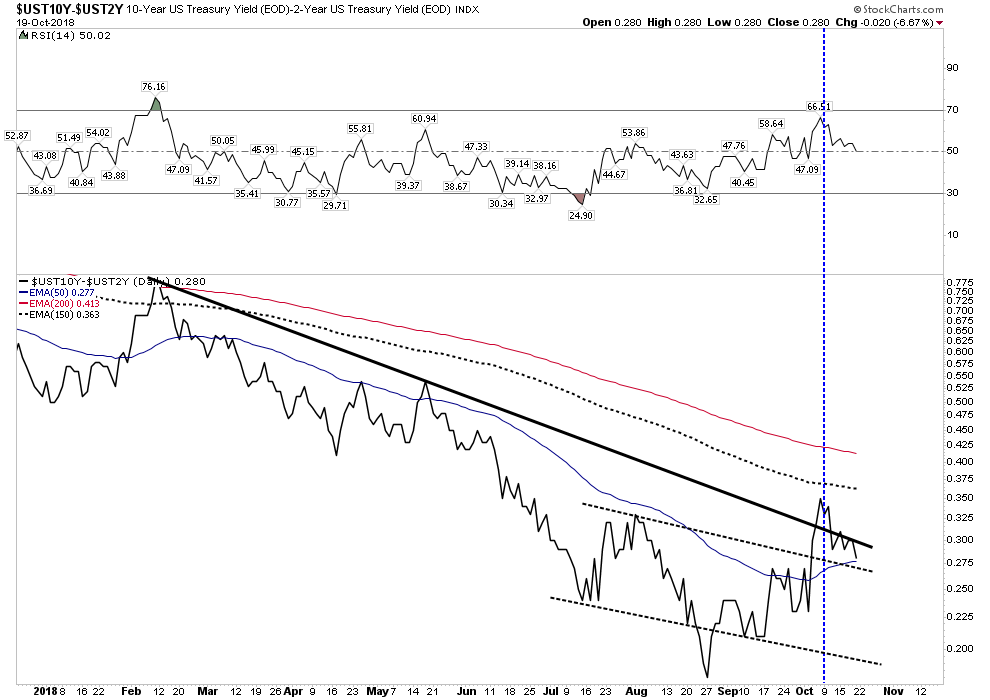
So the actual signal comes when the spread establishes itself in an uptrend after a reversal. As a chartologist looking at the chart above I would say we are almost there. The initial reversal occurred on August 27th and then entered an uptrend. It’s a nice inverted H&S which is now backtesting its breakout above its dashed neck line, but it couldn’t hold above the solid thick down trend line. If it resumed its advance above its Oct 8th peak I would consider it an established uptrend and expect a panic exit of the market.
So here is my analysis: Note the vertical blue dashed line placed on Oct 9th one trading day after the peak in the spread. This is the day that institutional money decided to exit this market en mass resulting in a 1500 Dow point blood bath over the next two days. I would argue the triggering mechanism was our spread breaking out above the solid downtrend line which made it appear as if a new trend was being established. This changed the psychology and as the vertical breakout panicked managed money as they kept one eye on this indicator. We now see however, that this move may have been a false breakout so we may have to wait for confirming upside for the real fireworks to begin. Once it can resume an uptrend above the 150 EMA and certainly the 200 EMA money flow will be in full retreat.
Mr. Markets Most Diabolical Scenario
We all know Mr. Market is a fooler. He makes his moves only after putting most players on the wrong side. This may be what is occurring right now so what would that scenario look like? One more washout to the downside violating the mid-Oct lows would flush out the market and set it up for an nice year end rally. It would spawn hope and draw in investors for the real killing that may lie ahead. After rekindling animal spirits a year end rally could then fail towards the end of the year or even into the first quarter. What would indexes look like then? They would trace out Mr. Markets most diabolical scenario:
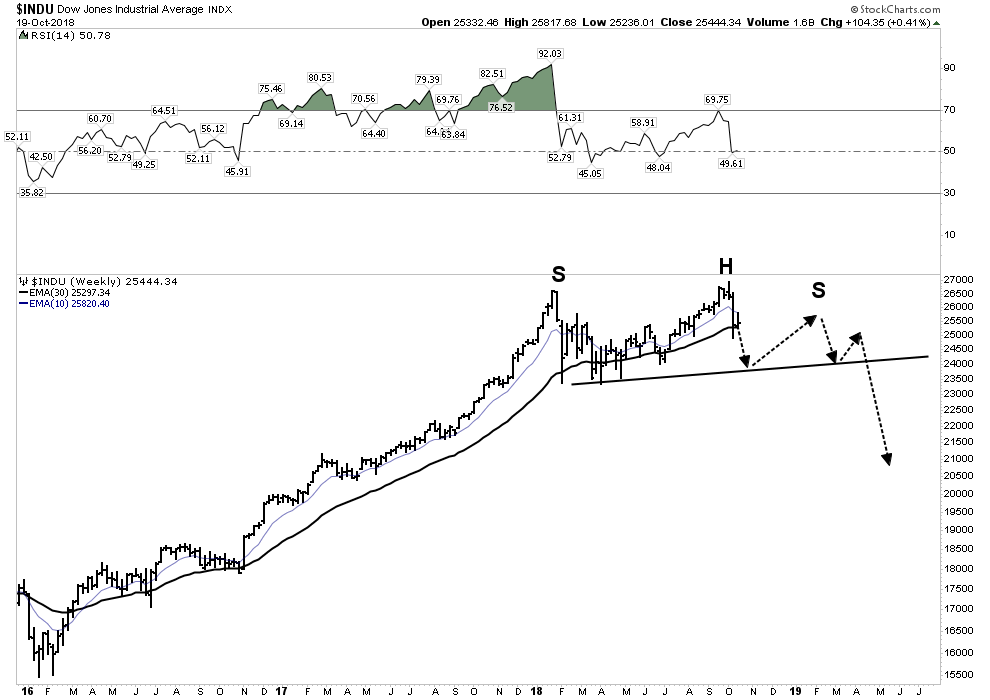
Above Projection: 2019-The Year of the Bear, a massive authoritative distributive H&S top.
I hope you have taken your blinders off and see these markets with eyes wide open. The world wide post bubble contraction is unfolding according to script. It is something no living investor has seen before so few are able to understand it. A PBC is very slow moving as it plays out over 15 years so 99% of investors are unable to recognize it for what it is. That provides us immense opportunity.
https://rambus1.com/2018/10/21/weekend-report-2019-the-year-of-the-bear-market/
So all year long the world’s markets have been bleeding out, but the USA has not felt it, but that’s all changed over the past 2 weeks and we are now starting to see what it feels like when liquidity starts to get drained from the system. Look at these two leading interest rate sensitive sectors: autos and builders.
The Home Builders– Brutally Relentless
These are sectors that drive the economy, these two charts are showing the market discounting weakness ahead.
State of the US Markets- At a precipice?
I would say it’s getting close, but not starting the big decline yet, hence the title “The Bear Market of 2019”. Let’s review my hedge fund exit indicator which shows the spread between the 10 and 2 year treasury. You no doubt have heard that the economy goes into recession when the yield curve inverts. Well there are plenty of cases where the economy went into recession without the curve actually inverting, just slightly flattening. So this old saw is an unreliable indicator. What isreliable is when short rates begin to drop after they have been rising in a mature cycle. That’s because it’s saying the jig is up and the economy can no longer support higher short term rates. This is the signal that hedge fund managers who have over stayed themselves in this market are looking for to exit the market. We can see this occurring now in the below chart signaled by the spread rising.
So the actual signal comes when the spread establishes itself in an uptrend after a reversal. As a chartologist looking at the chart above I would say we are almost there. The initial reversal occurred on August 27th and then entered an uptrend. It’s a nice inverted H&S which is now backtesting its breakout above its dashed neck line, but it couldn’t hold above the solid thick down trend line. If it resumed its advance above its Oct 8th peak I would consider it an established uptrend and expect a panic exit of the market.
So here is my analysis: Note the vertical blue dashed line placed on Oct 9th one trading day after the peak in the spread. This is the day that institutional money decided to exit this market en mass resulting in a 1500 Dow point blood bath over the next two days. I would argue the triggering mechanism was our spread breaking out above the solid downtrend line which made it appear as if a new trend was being established. This changed the psychology and as the vertical breakout panicked managed money as they kept one eye on this indicator. We now see however, that this move may have been a false breakout so we may have to wait for confirming upside for the real fireworks to begin. Once it can resume an uptrend above the 150 EMA and certainly the 200 EMA money flow will be in full retreat.
Mr. Markets Most Diabolical Scenario
We all know Mr. Market is a fooler. He makes his moves only after putting most players on the wrong side. This may be what is occurring right now so what would that scenario look like? One more washout to the downside violating the mid-Oct lows would flush out the market and set it up for an nice year end rally. It would spawn hope and draw in investors for the real killing that may lie ahead. After rekindling animal spirits a year end rally could then fail towards the end of the year or even into the first quarter. What would indexes look like then? They would trace out Mr. Markets most diabolical scenario:
Above Projection: 2019-The Year of the Bear, a massive authoritative distributive H&S top.
I hope you have taken your blinders off and see these markets with eyes wide open. The world wide post bubble contraction is unfolding according to script. It is something no living investor has seen before so few are able to understand it. A PBC is very slow moving as it plays out over 15 years so 99% of investors are unable to recognize it for what it is. That provides us immense opportunity.
https://rambus1.com/2018/10/21/weekend-report-2019-the-year-of-the-bear-market/
Similar threads
-
-
Collective Investment Scheme in stocks and futures trading?
- Started by rakamaka
- Replies: 7
-
 Trading Futures: Indices Vs Individual Stocks
- Started by Trade_Artist
- Replies: 9
-
-