Bollinger Bands and Keltner Channels
Hello everyone,
John Bollinger came up with this back in the 90s. But before that Keltner Channels have been long around and still used successfully by many traders.
I tend to switch to Bollinger Bands from Keltner Channels(S&P emini; not familiar with Nifty Fifty yet!!) say after a trend day where you can often expect consolidation. Typically you can see back and forth movement of prices and contained well within the upper and lower bands.
I will paste this from Linda Raschke's website and highlight a few parts in case anyone is interested to experiment with Keltner Channels.
What are Keltner Channels?
Keltner Channels are a form of trading bands plotted directly on top of a price chart, as opposed to beneath the price chart as in the case of an oscillator or volume.
The bands are based on an ATR function centered around a moving average. We use a value of 2.5 ATRs added to and subtracted from a 20-period exponential moving average to create our bands.
What is the difference between Keltner Channels and Bollinger Bands?
Bollinger Bands are based on a standard deviation function.
Very often, you will see times where the market is moving HIGHER but the lower Bollinger band is declining. This does not happen with Keltner channels. Though both are based on a volatility functions,
Keltner Channels will maintain a more constant width than Bollinger Bands and thus we find them more pleasing to our eye.
We also have had much better success in using range functions in our quantitative modeling as opposed to standard deviation functions, especially when creating short-term timing systems
Bollinger Band trades
we use 2.5 standard deviation bands centered around a 20 period moving average to make trades on the day following a trend day. we do these trades in the morning session only. the concept behind this is that a push to the upper or lower band will setup a countertrend trade. the objective is a push back to the moving average. no stops were used in our testing, we just used an exit of whenever the trade hit the moving average or end of day in the worse possible scenario.
Caution: I'm not familiar with Nifty fifty intraday and daily moves yet. So, please spend enough time experimenting with this in simulation mode and see how if fits your style. All charting packages probably have this indicator available and you can most likely insert it onto any chart on any time frame.
I hope to hear from anyone interested in using it until I get familiar with the price action of Nifty..........
Hope this helps.
Thank you everyone.
Shreenath
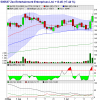
BB(20,2) on 3min and 5min timeframes are presented.
Upto 1400 hrs
almost there was no candle in
bottom band.