I can help you with stock chart reading

Status
Not open for further replies.
vvonteru said:
I apologize for not replying earlier.

NO NEW ENTRY means, I am suggesting to all readers that I do not approve these stocks for new positions. Based on my analysis, I don't want somebody to think (based on stops) I am suggesting to buy them. Now, if U have already took positions in these stocks, there are couple of options.
1. Exit for profit if the stock chart is really bad.
2. Gracefully exit for no loss no profit.
3. Give a stop for last chance for the stock to make it.

Lets see how these options apply to your stocks.

1. 3i infotech 192
This stock can be exited gracefully with no profit no loss. It is in trading range. Wait for couple of days, it should be close to 192. Exit then.

2. RNRL 35
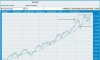
My expertise is not with low priced stocks. Please see the chart attached. A triangle has formed. A decision soon will come, up or down. We can keep this stock if it goes up (no brainer). If it goes down, how far will it go down (already 35). The stock has to be evaluated based on fundamentals more than technicals. How about asking the guy who suggested you this stock.

3. Tvs motor 178
This is a case of good stock with a bad entry. Keep this for now. Hopefully, U can get out of this too with no profit no loss.

4. Marksans pharm 244
I wish it didn't break 230. If it comes back above that in the next couple of days, its a keeper till U exit gracefully. If it goes below 200, U exit.

U know, it is easier to read charts that are good than the bad ones. All these charts, I wouldn't spare a millisecond (infact thats the test). Now, trying to understand them and make meaning out of them is hard.

About my suggestions, right now, I am not recommending any new entries because of market and sector conditions. I will post it when market conditions improve.
hi vv,
Thanks for your good suggestion, Now i am learning from your experience. I fully agree with all your advice.
Sir One quiry i have, Actually i am not able to see stock chart at bseindia.com in internet explorer only blank space seen? i have seen it other place but at my home it is not working. So if u or any senior knows the solution of this problem pl. tell me.
Thanks again for your such a good advice.
Thanks Sir
rgrds
Ahmed
 
mahmeds2000 said:
hi vv,
Thanks for your good suggestion, Now i am learning from your experience. I fully agree with all your advice.
Sir One quiry i have, Actually i am not able to see stock chart at bseindia.com in internet explorer only blank space seen? i have seen it other place but at my home it is not working. So if u or any senior knows the solution of this problem pl. tell me.
Thanks again for your such a good advice.
Thanks Sir
rgrds
Ahmed
What version of IE do you have? I have 6.0.2900.2180.xpsp_sp2_gdr.050301-1519.
May be others can help U who had similar experience. Why don't U try
http://charting.bseindia.com/charting/index.asp
 
moneymatters said:
hi,

i visited the links u have given. but i could not understand how to analyse it.
Pl tell me how can it be analysed.

Hope i am not disturbing you.

waiting for ur rep

regards

cyril
What I am saying is that, don't take new positions in stocks other than in Metals sector. All other sectors look bad.
 
Hi Vvonteru,

I am new to this forum, and reading your comments/explanations from last few days. I am beginner in trading, learning fundamental from last 3-4 months and start trading from last month. I am going to do some more investment in next 1-2 months. I'm not planning much short term, but 6 months to 1 year investment. And like to use your experience and knowledge to pick good stock or right one.

Here is my list, must be long ;)

+ Hind Zinc [106.20]
+ JindalStainless [120.65]
+ Hindalco [224.40]
+ Guj Ambuja Cem [124.05]
+ SAIL [83.90]
+ IPCL [272]
+ Finolex Ind [96]
+ Bata India [272.65]
+ Rolta [252.80]
+ Sterlite Optic [185.50]

I would be grateful if you suggest me 2-3 or max 5 stocks, in which I can go for investment for 6mon to 1year period.

Thanks in advance,

REgs,
- Dinesh Sailor
 
Hi Vvonteru,

I started reading the book "Come into my trading room" of Alexander Elder as per your suggestion. The book is really good and I would like to thank you for your great suggestion.

However, I have a small question. I could not understand much about the "Kangaroo tail" that was explained in the book as it was not explained with the help of any diagram or chart?. Could you please explain when ever you get some spare time. Hope that I am not disturbing you from your schedule. If you could explain it with the help of some chart, that would be helpful for me and other TA learners.

Thanks in advance,
Balaji.
 
pnbalaji said:
Hi Vvonteru,

I started reading the book "Come into my trading room" of Alexander Elder as per your suggestion. The book is really good and I would like to thank you for your great suggestion.

However, I have a small question. I could not understand much about the "Kangaroo tail" that was explained in the book as it was not explained with the help of any diagram or chart?. Could you please explain when ever you get some spare time. Hope that I am not disturbing you from your schedule. If you could explain it with the help of some chart, that would be helpful for me and other TA learners.

Thanks in advance,
Balaji.
U have to wait on the chart. But, let me explain what I understood (its been a while I read the book). Lets start with how stock prices go up or down. This is due to the demand for buy or sell. Lets take an example of RCVL. This has broken out of the trading range recently and closed at 320.60. If no demand exists for buying above 320.60 (no buy orders above 320.60) and sell orders exist below 320.60, the stock price will come down. I think so far U already know.

Now imagine some good news comes for RCVL. There are lots of traders who buy on news. They jump on news and put in buy orders. Most of them give market orders (they don't want to miss the action). The market makers (MM, who execute all the buy and sell orders in our behalf) see so many buy orders for RCVL and increase the buy price. Since these are market orders, they get executed no matter what the price is. Lets say more buy orders come in. MM see this as an opportunity and increase the price (On the intra day chart, U will observe a long open and close tick). They will push it so high till a point where no demand exists. Once U have this scenario, open a daily chart. The tick on that will have huge high (tail) low range. What we should read from the tick is that there is no demand at this high point and go for a short next day. Elder talks about the levels and stops for doing this. Similar is the case when the stock goes down.

Now, identifying the Kangaroo Tail is tricky (infact, I used to argue with my friend all the time. He used to look at some volatility on a day and say, there goes the kangaroo), just like using any indicators. Huge range can be there on any day. But, Kangaroo tail only applies on extremes. For example, when stock on a bad news is going down. After several days of sell of, U see a huge down bar, now thats a Kangaroo Tail. Why, because, the stock has been going down so low and at some point the MM tried to sell the last bit and found no orders to sell below that point. Similar is the case of upside.

Hope U got the point. I will see if I can get hold of a chart on it.

Dinesh, I will get back to U.

Guys, try to limit Ur request for stock suggestions to 2 or 3. Looking at a big list, I feel lazy and postpone it. What U could do, just give me 2. Later on, come with more.
 
Hi Vvonteru,

Thanks for the great explanation. Now I am getting a much better picture on "Kangaro tails". Hopefully, I might be able to find something like this on a chart soon.

Thanks,
Balaji.
 

SGM

Active Member
Hi Vvonteru,

How is Tata Tea, good move today, seems to be unable to brk abv 880-890 till now. Will it be a buy if closes abv that?

HFCL +15% today, can enter here?

Well, thats completes my quota of 2 stocks per post :)

India Cement is going along well, thanks!

Regards
Sanjay
 
Last edited:

SGM

Active Member
pnbalaji said:
Hi Vvonteru,

Thanks for the great explanation. Now I am getting a much better picture on "Kangaro tails". Hopefully, I might be able to find something like this on a chart soon.

Thanks,
Balaji.
Hello Balaji,
I think you should look for it on intra day charts (opening prices) on last friday, when mrkts were down by more than 500 points!

Once again thanks to you buddy for the link to download such a wonderful book, and Vvonteru for explaining the kangaroo tail so well!

Regards
Sanjay
 
Last edited:
SGM said:
Hello Balaji,
I think you should look for it on intra day charts (opening prices) on last friday, when mrkts were down by more than 500 points!
Regards
Sanjay
I don't think that applies in this scenario (ofcourse its my opinion). The stock should have been going down or up for lot of days. This should typically happen because of an event (which will determine this sharp break up or down). If the stock has been going flat, I don't know how much this applies. The pattern is more based on fear (traders) and greed (MM).

Friday's event could be a starting point.

Any way, I don't trade on this pattern. Not that U can't make money on it. It doesn't fit into my methodology of pull backs.

Market Update:
Market is still in trading range. Avoid new entries for now till the market successfully comes out of the trading range.
 

Attachments

Last edited:
Status
Not open for further replies.

Similar threads