Hello Sanjay,
Thanks for your test report. Frankly I do not do any back test for any of my indicators. I just look for indicators that give me early entries and exists. The test process I follow is visual and laborious which many may not be willing to do or will not look like a sensible method to some. I am a person who looks for the easiest and simple methods or ways with reliability.
For an example I would show a few trades using this Ichimokku indicator. I believe this indicator was in use for more than a century in Japan. Now we have to make sure this works in our modern day electronic trades.
I am not trying to prove anything but just show the way how I will be using this indicator. Let us use daily data of Reliance as an example.
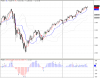
Let us first take 13th Sep 2006 when Ichimokku had given a buy signal. The close price is Rs.1116.15. Since I got a buy signal first thing I would like to check is where the price is in relation to MA(C,15). If you look at the charts the price has crossed MA(C,15) and closed just below it . Note also the rising slope of MA(C,15) and price climbing towards it. For additional confirmations RSI(15) is above 50 and climbing and also close well above EMA(C,50). I do not use RSI or other Oscillators much since their figures are always between +100 and -100 which are not very helpful in selecting stop loss or price target figures for your trades.
On the same date if you like to look at Nifty it can be seen there is a buy signal from Ichimokku and Nifty has closed above MA(C,15). Since Reliance is a Nifty component this information is useful
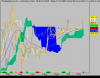
When Ichmokku gives a buy signal I look for certain characteristics in the SL , TL and Close lines in Ichimokku. I do not use DL line as it is future looking. For me when the buy signal was given I would like to see lines in the following order. SL at bottom and Red on top of SL preferably with some gap between these lines.
Now for Money management and position sizing. I will take only a maximum risk of 2% on my Account size of Rs 1 Lakh and commission I have to pay one way for delivery is .37%(Actual one way comission is .35 but I add .02 as STT and other charges)
Now my usual entry price is 2-3 Rs above close. That is Rs.1119. The Stop Loss I usually follow is a fixed price of 10-15 Rs per trade. Both entry price and Stop Loss vary according to the price of the scrips. For lower priced scrips it will be much tighter. So in this case my stop loss is Rs. 1104.
Using Ichimokku figures also stop loss can be set. In this case I can keep TL figure of Rs 1109.55 or if I want a wider stop I can use SL figure of Rs 1074.10 which works out to roughly nearly 4% from close price.
My Risk to reward ratio is 2:1.
Based on the above parameters my trade size quantity is 86 shares and money at risk is Rs.1197.36 for this trade if the trade goes against me and my stop is hit. Money in use for this trade is Rs.96,590. which is with in my Account Size.
The Break even price (BEP) is Rs.1127.30. My target price for the desired Risk reward ratio of 2:1 is Rs.1173.93 (4.91%).
Now you can hold on to the long position till Ichimokku or any of your other indicators give sell signal or your stop is hit or price target achieved. In this case stop is not hit but ichimokku gave a sell signal only on 3rd Oct 2006. The price target was achieved on 25th and 26th Sep 2006. giving you a net profit of Rs 4000. on this trade(4.91 %).
Let us assume if the price has gone up but has not touched the target and price starts reversing down. In such a situation what I usually do is if price on the way own has reached my BEP i will get out there without any loss or sell my position at my entry price with commission loss only. Since I can always re enter the position I would prefer to get out at entry price. I get out at stop loss only when price after entry straight away goes down.
Now another point is in this case we have a price target set by Money management technique based on a Risk reward ratio of 2:1. But suppose assume if we had SL or TL line on top of close then we can use these lines as target price or to make a decision to enter the trade by comparing the RR ratio with SL and TL figures. So in effect we can weed out trades which are not profitable. Or another more safer method is if SL is on top of TL and gap between these lines are narrow and close in between I would prefer to enter when close cuts or closes above SL line even though buy signal is already given earlier when close cut TL. Example is Reliance 11th Aug 2006 buy signal, 15th June 2006,
An example is buy signals on 31st Oct 2005. Here the close is between SL and TL and the lines are not in proper order. For a very strong buy usually TL will be above SL. But if a person is interested in quick profits he has a price target of Rs 774 or more. Here also if he enters at an entry price of Rs 765 (Rs 3 + previous close) with a stop loss of Rs. 755 or use the TL figure of Rs 758 as stop the trade size is 128 shares with a target price of Rs. 802 as per Money management which was reached 11th Nov 2005 on wards.
Since his BEP is Rs.770 he can choose to get out at close price of Rs.777(2nd Nov 2005) for a small profit also. In this case also the price is well above his entry price. In fact if the position is held he could have sold it at the close of Rs 817 on 16th Nov 2005 which is well above the target price set by money management of Rs.802. Net profit being Rs. 5906 (6.80%).
Now the doubt arises this guy is showing all good trades especially when market is trending strongly. How about trades when markets are down or consolidating. Let us try it out.
I will show an example of a false buy signal. Reliance 23rd May 2006 , On22nd May 2006 according to the original Ichimokku sell condition the TL line had crossed SL line from above. Look at the other false buy signals on 26th May 2006, 2nd June 2006 and 9th June 2006 and price refusing to go below EMA(C,50) though later on it went below the EMA. In all these cases we could have taken a buy position if we had waited for the close to cross SL since SL was dropping down and TL holding steady.
But on 15th June 2006 buy signal close crossed SL on 19th June 2006 and on 21st June 2006 TL crossed SL from below as per original Ichimokku buy condition.
One other important characteristic I look for in an indicator is whether it will work under any market conditions.
For example look at Reliance from 10th may 2004 when Nifty also is falling down. On 13 th May 2004 there is buy signal in Reliance Ichimokku but in Nifty there is no buy signal.
Will you enter the trade just because there is a buy signal?
If you look at Reliance Ichimokku the TL is falling downwards and SL is on top of TL. Price well below MA(C, 15) and its slope is down wards. Price also below EMA(C,50). And the price is creating new lower lows.
Another important point is that on the Same day TL has crossed SL from above a clear sell indication as per Original Ichimokku guidelines. I will not take this long trade which is confirmed by next day sell signal. The only stop loss figure I can calculate is that of Money management or a fixed price stop in this case. I have no option to select any other figure as stop since price is already below SL, TL, MA(C, 15) and EMA(C, 50).
But i decide to enter a short Position. Here I have the option to select SL, TL, MA(C, 15) and EMA(C,50) as stop figures other than a fixed price stop. Moreover the price, Nifty and Indicators are supporting Short position.
So using the same money management and position sizing we can enter short position. Say at an entry price of Rs 512 on 14 th Ma 2004 with a stop of Rs 524 (Fixed price stop of Rs 12). On a trade size of 126 shares the very next days close of Rs.404 will have given you a net profit of Rs. 13,180(21%).
Now to go to 12th Aug 2002 Reliance Chart. Ichimokku has given a buy signal. But close in between SL and TL and good gap between SL and TL. Price below MA(C, 15) and its slope is down wards but price climbing upwards to MA(C, 15) . Price also well below EMA(C,50).
Look at Nifty on same date. Buy signal in Ichimokku . Nifty below MA(C, 15) and its slope is down wards but Nifty climbing upwards to MA(C, 15) . Nifty also well below EMA(C,50).
Will you take this long trade? It is possible to take this trade. Look at price. The close never crossed the TL on 14th Aug 2002 although it just rested on top of TL line without a sell signal cross. In my experience when after a buy cross or in a retracement after a continuous rise in price if close comes very close to TL line but fails to cut it and there are no sell signal arrows it is a very powerful upward move set up .
I can give more examples of the same set up in Reliance itself. 23 May 2003, 24 june 2003, 5th august 2003 etc. and in Reliance capital 11 th Sep 2006,
Nifty 11th Nov 2002, 28th july 2004, 8th March 2006, 23 Aug 2006,
In this case it is supported by the original Ichimokku buy condition of TL crossing SL from below on 26th Aug 2002.
Of course there will be false signals. But with experience and Money management, position sizing you can easily avoid such trades. There are many more ways to trade using Ichimokku especially short trades with small profits. That is another topic.
So now let us come to the point of your test results. In your back test can you incorporate the conditions like position of lines in Ichimokku when a buy cross is given , Price below or above MA Lines, Trade size, stop loss, price target etc as I have mentioned above under various scenarios. Your current test will have in all probability included all buy or sell signals generated by Ichimokku. In my case many of these buy or sell signals I would have avoided or the number of my successful trades will be more than failed ones there by resulting in net profit. If such conditions or criteria incorporated will the backtest results be the same. Please do try it out if it is possible and when you have time.
What I am trying to convey is an advice given to me a few years before by one of the top AFL experts when I e -mailed to him for help regarding a code. In is reply he had advised me to visually observe the price charts along with indicators. This means when an indicator gives a buy or sell signal what factors along with movement of price made the buy or sell signal a success or why a buy or sell signal failed or what are the other indicators saying with regard to such buy or sell signals.
In a back test I am not sure I will be able to look at all buy or sell signals individually along with my entry, exit or other conditions. I too had earlier tried optimization, Monte carlo technique etc. Any way it was nice looking at 3D charts of this stuff. To be honest I still do not know what all these means. It is latin to me. I do envy people like you when you all talk of these stuff. May be I was never interested in learning the hard way.
I do not know how to code in AFL when close will just rest on TL as I mentioned above without a cross sell signal before the upward move. May be it is possible to code it. But i just do not have that capability.
Like I said earlier I like to keep it simple. During a trade all I wanted to remember is my BEP, entry price, Stop loss and price target nothing else. If trade gone wrong a free mind for a quick exit. If it is a buy I want it to go up and give me profits. If not I am out with minimum injury. Not for me DOW, Sensex, ADRs, Elliot ,Gann etc and a whole lot of stuff. It is beyond my capacity. I would prefer to trade just on price charts and few indicators nothing else.
Moreover in a visual search and study method the patterns and setups are clearly imprinted in the mind so any time it occurs again I know exactly what to do. All I have to do is run an AA analysis in Amibroker using Ichimokku every day. The results are then combed to weed out false signals by using other conditions or in combination with other indicators or price action. Then using Ichimokku you need not scan every day. If you get one or two scrips matching your set up it is more than enough to trade for a couple of weeks in the same scrips.
Our results differ because our trading styles also differ. My trade set ups are mostly based on visual confirmations which are very difficult to be coded. And kindly also note in some of the above trades I have earned between 5-20% return per trade and my risk % is only 2% per trade. So in all probability my net returns will be positive..
If you are using Ichimokku on weekly data then it is better to increase the stop loss figure as there could be bigger fluctuations in price.
So thanks Sanjay for your time and efforts. Perhaps all of us pool together our knowledge and trade better. Do post your suggestions and valuable observations when you have time.
Regards
Saji
Thanks for your test report. Frankly I do not do any back test for any of my indicators. I just look for indicators that give me early entries and exists. The test process I follow is visual and laborious which many may not be willing to do or will not look like a sensible method to some. I am a person who looks for the easiest and simple methods or ways with reliability.
For an example I would show a few trades using this Ichimokku indicator. I believe this indicator was in use for more than a century in Japan. Now we have to make sure this works in our modern day electronic trades.
I am not trying to prove anything but just show the way how I will be using this indicator. Let us use daily data of Reliance as an example.
Let us first take 13th Sep 2006 when Ichimokku had given a buy signal. The close price is Rs.1116.15. Since I got a buy signal first thing I would like to check is where the price is in relation to MA(C,15). If you look at the charts the price has crossed MA(C,15) and closed just below it . Note also the rising slope of MA(C,15) and price climbing towards it. For additional confirmations RSI(15) is above 50 and climbing and also close well above EMA(C,50). I do not use RSI or other Oscillators much since their figures are always between +100 and -100 which are not very helpful in selecting stop loss or price target figures for your trades.
On the same date if you like to look at Nifty it can be seen there is a buy signal from Ichimokku and Nifty has closed above MA(C,15). Since Reliance is a Nifty component this information is useful
When Ichmokku gives a buy signal I look for certain characteristics in the SL , TL and Close lines in Ichimokku. I do not use DL line as it is future looking. For me when the buy signal was given I would like to see lines in the following order. SL at bottom and Red on top of SL preferably with some gap between these lines.
Now for Money management and position sizing. I will take only a maximum risk of 2% on my Account size of Rs 1 Lakh and commission I have to pay one way for delivery is .37%(Actual one way comission is .35 but I add .02 as STT and other charges)
Now my usual entry price is 2-3 Rs above close. That is Rs.1119. The Stop Loss I usually follow is a fixed price of 10-15 Rs per trade. Both entry price and Stop Loss vary according to the price of the scrips. For lower priced scrips it will be much tighter. So in this case my stop loss is Rs. 1104.
Using Ichimokku figures also stop loss can be set. In this case I can keep TL figure of Rs 1109.55 or if I want a wider stop I can use SL figure of Rs 1074.10 which works out to roughly nearly 4% from close price.
My Risk to reward ratio is 2:1.
Based on the above parameters my trade size quantity is 86 shares and money at risk is Rs.1197.36 for this trade if the trade goes against me and my stop is hit. Money in use for this trade is Rs.96,590. which is with in my Account Size.
The Break even price (BEP) is Rs.1127.30. My target price for the desired Risk reward ratio of 2:1 is Rs.1173.93 (4.91%).
Now you can hold on to the long position till Ichimokku or any of your other indicators give sell signal or your stop is hit or price target achieved. In this case stop is not hit but ichimokku gave a sell signal only on 3rd Oct 2006. The price target was achieved on 25th and 26th Sep 2006. giving you a net profit of Rs 4000. on this trade(4.91 %).
Let us assume if the price has gone up but has not touched the target and price starts reversing down. In such a situation what I usually do is if price on the way own has reached my BEP i will get out there without any loss or sell my position at my entry price with commission loss only. Since I can always re enter the position I would prefer to get out at entry price. I get out at stop loss only when price after entry straight away goes down.
Now another point is in this case we have a price target set by Money management technique based on a Risk reward ratio of 2:1. But suppose assume if we had SL or TL line on top of close then we can use these lines as target price or to make a decision to enter the trade by comparing the RR ratio with SL and TL figures. So in effect we can weed out trades which are not profitable. Or another more safer method is if SL is on top of TL and gap between these lines are narrow and close in between I would prefer to enter when close cuts or closes above SL line even though buy signal is already given earlier when close cut TL. Example is Reliance 11th Aug 2006 buy signal, 15th June 2006,
An example is buy signals on 31st Oct 2005. Here the close is between SL and TL and the lines are not in proper order. For a very strong buy usually TL will be above SL. But if a person is interested in quick profits he has a price target of Rs 774 or more. Here also if he enters at an entry price of Rs 765 (Rs 3 + previous close) with a stop loss of Rs. 755 or use the TL figure of Rs 758 as stop the trade size is 128 shares with a target price of Rs. 802 as per Money management which was reached 11th Nov 2005 on wards.
Since his BEP is Rs.770 he can choose to get out at close price of Rs.777(2nd Nov 2005) for a small profit also. In this case also the price is well above his entry price. In fact if the position is held he could have sold it at the close of Rs 817 on 16th Nov 2005 which is well above the target price set by money management of Rs.802. Net profit being Rs. 5906 (6.80%).
Now the doubt arises this guy is showing all good trades especially when market is trending strongly. How about trades when markets are down or consolidating. Let us try it out.
I will show an example of a false buy signal. Reliance 23rd May 2006 , On22nd May 2006 according to the original Ichimokku sell condition the TL line had crossed SL line from above. Look at the other false buy signals on 26th May 2006, 2nd June 2006 and 9th June 2006 and price refusing to go below EMA(C,50) though later on it went below the EMA. In all these cases we could have taken a buy position if we had waited for the close to cross SL since SL was dropping down and TL holding steady.
But on 15th June 2006 buy signal close crossed SL on 19th June 2006 and on 21st June 2006 TL crossed SL from below as per original Ichimokku buy condition.
One other important characteristic I look for in an indicator is whether it will work under any market conditions.
For example look at Reliance from 10th may 2004 when Nifty also is falling down. On 13 th May 2004 there is buy signal in Reliance Ichimokku but in Nifty there is no buy signal.
Will you enter the trade just because there is a buy signal?
If you look at Reliance Ichimokku the TL is falling downwards and SL is on top of TL. Price well below MA(C, 15) and its slope is down wards. Price also below EMA(C,50). And the price is creating new lower lows.
Another important point is that on the Same day TL has crossed SL from above a clear sell indication as per Original Ichimokku guidelines. I will not take this long trade which is confirmed by next day sell signal. The only stop loss figure I can calculate is that of Money management or a fixed price stop in this case. I have no option to select any other figure as stop since price is already below SL, TL, MA(C, 15) and EMA(C, 50).
But i decide to enter a short Position. Here I have the option to select SL, TL, MA(C, 15) and EMA(C,50) as stop figures other than a fixed price stop. Moreover the price, Nifty and Indicators are supporting Short position.
So using the same money management and position sizing we can enter short position. Say at an entry price of Rs 512 on 14 th Ma 2004 with a stop of Rs 524 (Fixed price stop of Rs 12). On a trade size of 126 shares the very next days close of Rs.404 will have given you a net profit of Rs. 13,180(21%).
Now to go to 12th Aug 2002 Reliance Chart. Ichimokku has given a buy signal. But close in between SL and TL and good gap between SL and TL. Price below MA(C, 15) and its slope is down wards but price climbing upwards to MA(C, 15) . Price also well below EMA(C,50).
Look at Nifty on same date. Buy signal in Ichimokku . Nifty below MA(C, 15) and its slope is down wards but Nifty climbing upwards to MA(C, 15) . Nifty also well below EMA(C,50).
Will you take this long trade? It is possible to take this trade. Look at price. The close never crossed the TL on 14th Aug 2002 although it just rested on top of TL line without a sell signal cross. In my experience when after a buy cross or in a retracement after a continuous rise in price if close comes very close to TL line but fails to cut it and there are no sell signal arrows it is a very powerful upward move set up .
I can give more examples of the same set up in Reliance itself. 23 May 2003, 24 june 2003, 5th august 2003 etc. and in Reliance capital 11 th Sep 2006,
Nifty 11th Nov 2002, 28th july 2004, 8th March 2006, 23 Aug 2006,
In this case it is supported by the original Ichimokku buy condition of TL crossing SL from below on 26th Aug 2002.
Of course there will be false signals. But with experience and Money management, position sizing you can easily avoid such trades. There are many more ways to trade using Ichimokku especially short trades with small profits. That is another topic.
So now let us come to the point of your test results. In your back test can you incorporate the conditions like position of lines in Ichimokku when a buy cross is given , Price below or above MA Lines, Trade size, stop loss, price target etc as I have mentioned above under various scenarios. Your current test will have in all probability included all buy or sell signals generated by Ichimokku. In my case many of these buy or sell signals I would have avoided or the number of my successful trades will be more than failed ones there by resulting in net profit. If such conditions or criteria incorporated will the backtest results be the same. Please do try it out if it is possible and when you have time.
What I am trying to convey is an advice given to me a few years before by one of the top AFL experts when I e -mailed to him for help regarding a code. In is reply he had advised me to visually observe the price charts along with indicators. This means when an indicator gives a buy or sell signal what factors along with movement of price made the buy or sell signal a success or why a buy or sell signal failed or what are the other indicators saying with regard to such buy or sell signals.
In a back test I am not sure I will be able to look at all buy or sell signals individually along with my entry, exit or other conditions. I too had earlier tried optimization, Monte carlo technique etc. Any way it was nice looking at 3D charts of this stuff. To be honest I still do not know what all these means. It is latin to me. I do envy people like you when you all talk of these stuff. May be I was never interested in learning the hard way.
I do not know how to code in AFL when close will just rest on TL as I mentioned above without a cross sell signal before the upward move. May be it is possible to code it. But i just do not have that capability.
Like I said earlier I like to keep it simple. During a trade all I wanted to remember is my BEP, entry price, Stop loss and price target nothing else. If trade gone wrong a free mind for a quick exit. If it is a buy I want it to go up and give me profits. If not I am out with minimum injury. Not for me DOW, Sensex, ADRs, Elliot ,Gann etc and a whole lot of stuff. It is beyond my capacity. I would prefer to trade just on price charts and few indicators nothing else.
Moreover in a visual search and study method the patterns and setups are clearly imprinted in the mind so any time it occurs again I know exactly what to do. All I have to do is run an AA analysis in Amibroker using Ichimokku every day. The results are then combed to weed out false signals by using other conditions or in combination with other indicators or price action. Then using Ichimokku you need not scan every day. If you get one or two scrips matching your set up it is more than enough to trade for a couple of weeks in the same scrips.
Our results differ because our trading styles also differ. My trade set ups are mostly based on visual confirmations which are very difficult to be coded. And kindly also note in some of the above trades I have earned between 5-20% return per trade and my risk % is only 2% per trade. So in all probability my net returns will be positive..
If you are using Ichimokku on weekly data then it is better to increase the stop loss figure as there could be bigger fluctuations in price.
So thanks Sanjay for your time and efforts. Perhaps all of us pool together our knowledge and trade better. Do post your suggestions and valuable observations when you have time.
Regards
Saji