Teach A Man To Fish And.........

Status
Not open for further replies.

avinash

Active Member
Saint said:
Hi Anupama,

Okay in continuation..........we now know what a secular,primary trends and intermed trends are.We know that each larger time frame has within it smaller time frames of trends.Now,to your question.........we have an intermed uptrend,followed by an intermed downtrend,followed by an intermed uptrend,so on so forth.

Few rules:
1)After an intermediate uptrend,the correction should be only 33-66% of that cycle(One intermed cycle=one intermed uptrend and one intermed dntrend).
--Greater the retracement,the increased likelihood that the primary trend has reversed to the down.

2)Substantial increase in volume during the price decline

The above are the basics......if you are playing with indicators as well,then all the negative divergences,moving avg crossovers puts you on Caution Mode.

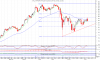
Have a look at the chart below.......please do ask if anything is not clear.

Gotta Run........World Cup Mode..

All the best!
Saint
Hello Saint!

The whole concept is much clearer now.......but just a suggestion,Saint.
Maybe you could indicate on this chart also of the primary trend,for clarity.

Thank you so very much for all the excellent articles.

Avinash
 
avinash said:
Hello Saint!

The whole concept is much clearer now.......but just a suggestion,Saint.
Maybe you could indicate on this chart also of the primary trend,for clarity.

Thank you so very much for all the excellent articles.

Avinash
Ahh,thanks Avinash.......that was the very purpose of that chart.Shall do.....attached below.

Saint
 
Last edited:

jdm

Well-Known Member
hi saint,

just going down the memory lane when stumbled upon the graphic. a very apt one to describe the current situation.

allow me to post the graphic, which you posted during the early part of this thread.

cheers,
jdm.
 

Attachments

jdm said:
hi saint,

just going down the memory lane when stumbled upon the graphic. a very apt one to describe the current situation.

allow me to post the graphic, which you posted during the early part of this thread.

cheers,
jdm.

That graphic is an absolute gem (Thanks Saint) and should be renamed ... am sure not only novices but also some semi-professionals get caught in those paradigms time and again

AGILENT;)
 
I am slowly trying and learning how to fish. I have bought myself a fishing rod now. Got metastock. Well friend loaded on my computer. But I promise to get an orignal one once I am more comfortable with it.
Great going,Rahul.......all the best!:)
I had a few questions to help me put worms on my hook. :)

1) How do we change from arithmetic to logirmethic scale.
Take your cursor to the Y-AXIS on the Meta stk Charts.Right Click and go to Y-AXIS PROPERTIES.Check the box in front of SEMI-LOG SCALE.

2) When I open a chart on the metastock it shows a stock from 2004
onwards. How can i change the period of the charts.
Period,meaning?You mean the no.of years that the X-Axis shows.......if that is what you meant,go to the Xaxis on your Charts.Right Click and go to X-AXIS PROPERTIES.And then put in from when you want on the box displayed

The rest for later.....

Saint
 
Anupama Singh said:
Hi Saint,

Thank you so very much for the explanations and the charts.

Sincerely,
Anu
Most welcome,Anupama.....

Saint
 
3) How do we use histograms on MACD. I mean I want to plot The difference
between the MACD and signal line. And also It gives me the option to
change the time period for the signal line( which is 9). But i am not able to
change the time period of the two moving averages used to plot MACD.

4) can you guide me what time periods should I use for the three simple
indicators( RSI, MACD, Stochastics). Right now I am using 14 days for
RSI. Stochastics 5 and 3. Signal line 9 and I am not sure what period it is
using for the plotting the MACD. And should we us different time periods
for daily charts, for weekly charts and for monthly charts. Also do they
change if market is volatile. If yes could pls briefly note them down for me.

I know these are too many questions but would help to get a start with my software.

Rgds

Rahul
Hi Rahul,

I basically use the RSI at 14,and the Stochs at 14,5,3.....but all this is more a personal preference.Play around with it till you attain comfort levels.And,no,I don't change the periods in different time frames.

Please do have a look at the link below for more education....

http://stockcharts.com/education/IndicatorAnalysis/indic_stochasticOscillator.html

http://stockcharts.com/education/IndicatorAnalysis/indic_RSI.html

http://stockcharts.com/education/IndicatorAnalysis/indic_MACD1.html

All the best!
Saint
 
A

amaren

Guest
hello a great thread.
i am new to teading and am very interested in the techinical analysis. i have purchased few books on techenical anylysis but i find oll of them dont actually tell you how to use the different graphs may be moving avrage or pscilloters. Rather they duel on how to construct it what actually is ie its defination. i couls not find in ay of my books how to interprate and use it to take trading decission. could u suggest me some good boks regarding interpration and how to use these charts..


Saint said:
Hello Friends,

As the famous Chinese Proverb goes,"Give a man a fish,you feed him for a day.Teach a man to fish,and you feed him for a lifetime."

This thread is a result of multiple emails from fellow members with a desire to learn how to trade,rather than to just take the calls here and there.This thread may not catch the interest of many,as the "many" are always interested in the 'fish' rather than learning how to.But this thread is intended for the few........the few that want to learn,or at least make a beginning to learn how to trade,the few that do not wish to bow to any other individual or organiztion as authority when it comes to decision making but instead wish to come to these decisions by himself/herself.

This thread will be of no help to those who make trading decisions based on the fundamentals.This thread will be of no help to the many that wish to know what this company did or wat was the news when a stock broke out.This thread will be of no use to a few members here,all brilliant traders,all great minds--Amit,Jaideep,Ajay,Vinay(JoyVerma),Joy_Mitali,Vince,Karthik,Ivan among others for there is nothing new that this thread has to offer to them,that they do not already know and are implementing day after day,trade after trade.

This thread is for the newcomer to charts and who has that desire to learn.It is for the student of the market by a student of the market.I am no master,no teacher,no expert,all words that I abhor........this thread is to my friends who want to learn,from a friend who is just sharing what little he knows.

All the best!
Saint
 
Dear Saint,

I am attaching two files of IVRCL. I have drawn trendline on both of them. In one I have drawn in which price low touches more often and in one I have drawn in which the first two lows are connected. Which would be more apt so I would be more sure about how to draw trendline.

And if we draw for a period of more than 2-3 years. How should we draw. try and connect most number of bottoms. pls elaborate. O maybe if u have some time you could take 2-3 stocks and draw the primary trend lines so i can have an idea.

Rgds

Rahul
 

Attachments

Status
Not open for further replies.

Similar threads