


Greetings to all.
Following code needs a small modification (for the below specified conditions):
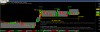
Also refer image for reference.
What the above code actually does:
-> Draws Horizontal lines at the top and bottom of specific candles (which moved >= 10%).
What I need:
(a) Need a filter to list out scrips.
(b) Small code needed to set candles range (through 'Parameters' option, candles range to be set; in this scenario, 50 candles range would be set).
(c) During 'Explore' from 'Analysis' window
(i) If there is a move of >= 10% within 50 candles range, then list out the scrip (here 10.28% seen hence PASS).
(ii) List out HIGH and LOW values (of candles which moved >= 10% within the specified range [set through 'Parameters'] option). Here 19.98%, 14.14% and 10.28% candles' H & L values.
Thanks so much in advance.
Following code needs a small modification (for the below specified conditions):
Also refer image for reference.
Code:
Show = ParamToggle( "style", "Bar|Candle", 1 );
if ( Show )
{
Sy=styleCandle;
}
else
{
Sy=styleBar;
}
color=ParamColor("Color",colorTan);
xshift=Param("Shift bar",0,-5,5,1);
zorder=Param("Zorder",0,-5,5,1);
width=Param("bar width/thickness",3,0,10,1);
PlotOHLC(Open,High,Low,Close,"",color,sy,Null,Null,xshift,zorder,width);

RP = ROC(C,1);
Pk1=RP>10;

x=Cum(1);
px1  = ValueWhen(pk1,x,1);
XT1h = ValueWhen(pk1,H,1);
XT1L = ValueWhen(pk1,L,1);
pk1H=IIf(x>px1,XT1h,Null);
pk1L=IIf(x>px1 ,XT1L,Null);
Col1=ParamColor("cloud col",colorGrey40);
Plot(pk1h,"",colorYellow,1);
Plot(pk1L,"",colorYellow,1);
PlotOHLC(0,pk1h,pk1L,0,"",Col1,styleCloud|styleNoLabel, Null, Null, Null, -1 );

//PARTIAL CODE - START
gxs=Param("GRAPH spaceing",10,5,50,5);
GraphXSpace = gxs;
//PARTIAL CODE - END

strWeekday = StrMid("SunMonTueWedThuFriSat", SelectedValue(DayOfWeek())*3,3);
if( Status("action") == actionIndicator )
(
Title = EncodeColor(colorWhite)+ "% Range" + " - " +  Name() +
 " | " + EncodeColor(colorLime)+ Interval(2) + EncodeColor(colorWhite) + "  #  "+strWeekday +" , "+ Date()+ ", %Chg : " + ROC( C, 1 )+
"\n"+EncodeColor(colorWhite) +"Op -"+O+" : "+EncodeColor(colorLime)+"Hi-"+H+" :  "+EncodeColor(colorOrange)+"Lo-"+L+"  : "+EncodeColor(colorTan)+ "Cl-"+C+" : "+EncodeColor(colorYellow)+ "Vol= "+ WriteVal(V,1)+EncodeColor(colorYellow)+ " , %chg  "+ ROC(V,1)
+"\n="+RP);-> Draws Horizontal lines at the top and bottom of specific candles (which moved >= 10%).
What I need:
(a) Need a filter to list out scrips.
(b) Small code needed to set candles range (through 'Parameters' option, candles range to be set; in this scenario, 50 candles range would be set).
(c) During 'Explore' from 'Analysis' window
(i) If there is a move of >= 10% within 50 candles range, then list out the scrip (here 10.28% seen hence PASS).
(ii) List out HIGH and LOW values (of candles which moved >= 10% within the specified range [set through 'Parameters'] option). Here 19.98%, 14.14% and 10.28% candles' H & L values.
Thanks so much in advance.
Attachments
-
 37.7 KB Views: 109
Last edited: