


Thoughts on Day/Swing Trading
- Thread starter Smart_trade
- Start date
- Status
- Not open for further replies.
R
THE 8-DAY HIGH/LOW REVERSAL METHOD:
FOR BUYS
1. Day one must be an eight-day low.
2. Day two must trade above the day-one high.
3. Days three or four or five or six must trade under the day-two low
(this can be a new low).
4. When condition three is satisfied, we buy one tick (1/8 for equities)
above the day-two high as long as the one-tick breakout occurs
within four trading days of condition three.
5. Our stop goes one tick below the day-two low.
FOR SELLS
1. Day one must be an eight-day high.
2. Day two must trade below the day-one low.
3. Days three, four, five, or six must trade above the day-two high
(this can be a new high).
4. When condition three is satisfied, we sell (short) one tick (1/8 for
equities) below the day-two low as long as it occurs within four
trading days.
5. Our stop is placed one tick above the day-two high
Larry Connors on Advanced Trading Strategies
Dear ST,
I would like to know how to use money management in leveraged instruments[Futures].
My risk appetite is 0.5% per trade of my total capital [ 1 lakh ]. And 2 % of my total capital for the whole day.
So can i use all my capital in leveraged instruments with strict MM or is it better to diversify the capital into Equities.
With Rs 1 lakh as capital and risk of 0.5 % on each trade means you can risk Rs 500 on each trade. There will hardly be any leveraged instrument which you can trade ( with exception of 1-2 lots of mininifty ).But that is not bad, you can trade mininifty. I have seen people making Rs 800-1500 profits everyday with 2 lots of mininifty. If you are daytrading , you may trade stocks which you can trade 80-120 shares as there is no fixed lot size for cash market stocks.
Be very careful and very strict with your stoplosses as you are trading with a shoe-string capital .But it is always better to start small and then trade large when you learn the market /trading and you are in full control of your trades.
Best Wishes for your success,
Smart_trade
Bloddy.... Bloddy Cool!!!!!!!!! :clapping::thumb:
SET UPs and TDSTs
I use Set ups and TDST which are sub systems of Thomas DeMark's Sequential method. I find that these TDST levels act as very good support and resistance levels. I use these levels to initiate new trades and also to book profits from my existing day trades and swing trades.
1) SET UP :
A.BUY SET UP ( Set up leading to a buy signal)
A buy set up is complete when we have a period of 9 consecutive bars whose closing is less than close of the bar 4 bars earlier
so if we call current bar as T then its closing has to be less than close of the bar 4 bars earlier i.e. T-4....so CT<CT-4 should be satisfied for all consecutive 9 bars.....if this relationship is discontinued...the set up gets cancelled and fresh set up needs to start afresh.
B.SELL SET UP ( Set up leading to a sell signal )
This is a mirror image of buy set up.....
A sell set up is complete when we have a period of 9 consecutive bars whose closing is more than close of the bar 4 bars earlier
so if we call current bar as T then its closing has to be more than close of the bar 4 bars earlier ie T-4....so CT>CT-4 should be satisfied for all consecutive 9 bars.....if this relationship is discontinued...the set up gets cancelled and fresh set up needs to start afresh.
Power of 9
In a buy set up after 9 bars the market exhibits a peculiar tendency. On 8th,9th or 10 th bar market makes a short term low and goes sideways to slightly up move....this is called Power of 9
In a Sell set up after 8th,9th or 10th bar the market will most likely make a short term top and go sideways to down in Power of 9
The following points are to be remembered in case of set ups :
1) Set up requires minimum 9 consecutive bars following a particular relationship. The set up does not end on 9th bar....it continues till the bar closing relationship is maintained.....
2) After Buy set up is complete, draw a horrizontal line from the true high of the first bar ( true high means high or the earlier bar's close whichever is higher ). This is called a TDST line......this acts as a resistance to any up move.
After Sell set up is complete, draw a horrizontal line from the true low of the first bar ( true low means low or the earlier bar's close whichever is lower ). This is called a TDST line......this acts as a support to any down move.
3) Low of the bar 9 of Buy set up will be generally lower than low of the bar 6 ....if it is not, then in next 3 bars low of bar 6 will be broken.
High of the bar 9 of Sell set up will be generally higher than high of the bar 6 ....if it is not, then in next 3 bars,high of bar 6 will be broken.
We will post some more examples of set ups to understand it better....
Smart_trade
THE 8-DAY HIGH/LOW REVERSAL METHOD:
FOR BUYS
2. Day two must trade above the day-one high.
Does this imply a gap up on day 2 ??
3. Days three or four or five or six must trade under the day-two low
(this can be a new low).
Again, is this about a gap down ??
FOR BUYS
2. Day two must trade above the day-one high.
Does this imply a gap up on day 2 ??
3. Days three or four or five or six must trade under the day-two low
(this can be a new low).
Again, is this about a gap down ??
THE 8-DAY HIGH/LOW REVERSAL METHOD:
FOR BUYS
1. Day one must be an eight-day low.
2. Day two must trade above the day-one high.
3. Days three or four or five or six must trade under the day-two low
(this can be a new low).
4. When condition three is satisfied, we buy one tick (1/8 for equities)
above the day-two high as long as the one-tick breakout occurs
within four trading days of condition three.
5. Our stop goes one tick below the day-two low.
FOR SELLS
1. Day one must be an eight-day high.
2. Day two must trade below the day-one low.
3. Days three, four, five, or six must trade above the day-two high
(this can be a new high).
4. When condition three is satisfied, we sell (short) one tick (1/8 for
equities) below the day-two low as long as it occurs within four
trading days.
5. Our stop is placed one tick above the day-two high
Larry Connors on Advanced Trading Strategies
Any example with chart ? Backtest etc ?
Hi smartji
First of all, a big thank you for starting this thread and sharing your knowledge on the forum. i accidentally stumbled on this website just like any other newbie looser while searching for genuine analysis on google.")
I went through all the pages i could and have to admit its a bit overwhelming, esp since im not a math guy nor a smart one....he he.
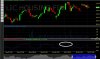
I was going through the LIC housing finance charts on cbloomnews.net....with stoch(8,3,4) setting and observed that around oct 3 it just about manage to stay in overbought zone for about 5 bars.... while previously it stayed in overbought zone for more than 5 bars on sep 26th and made a new high (although not a huge one). I would like to request you or the other experienced members to confirm this observation and let me know how to calculate the target, stop loss and entry if your charts agree as well . I apologize for asking the basic questions which might be redundant to experienced guys but i currently do not have a good charting software and hence managing with a free one.
First of all, a big thank you for starting this thread and sharing your knowledge on the forum. i accidentally stumbled on this website just like any other newbie looser while searching for genuine analysis on google.
I went through all the pages i could and have to admit its a bit overwhelming, esp since im not a math guy nor a smart one....he he.
I was going through the LIC housing finance charts on cbloomnews.net....with stoch(8,3,4) setting and observed that around oct 3 it just about manage to stay in overbought zone for about 5 bars.... while previously it stayed in overbought zone for more than 5 bars on sep 26th and made a new high (although not a huge one). I would like to request you or the other experienced members to confirm this observation and let me know how to calculate the target, stop loss and entry if your charts agree as well . I apologize for asking the basic questions which might be redundant to experienced guys but i currently do not have a good charting software and hence managing with a free one.
Attachments
-
 58.9 KB Views: 327
Also i would like to confirm my understanding about SBI as well here. as shown in the charts the last 2 times SBI has gone into the OS zone it has stayed for more than 5 bars (?) on hourly charts. Given the additional factor of 22 financial institutions being downgraded in europe on top of its own downgrade does it offer a strong risk/reward with stop loss at the Red candle high of 1810?
I sincerely apologize if the questions being asked is too obvious or silly but need a mentor to confirm my observations or point me in the right direction.
Edit: unable to attach as it says i have exceeded my attachment limit and i cant get the image size to be reduced in different formats.
I sincerely apologize if the questions being asked is too obvious or silly but need a mentor to confirm my observations or point me in the right direction.
Edit: unable to attach as it says i have exceeded my attachment limit and i cant get the image size to be reduced in different formats.
Last edited:
- Status
- Not open for further replies.
Similar threads
-
Looking for Feedback on a New Stock Market Research Tool – Your Thoughts?
- Started by Cate25
- Replies: 1
-
-
 Thoughts on "The A to Z of trading career - musings of a professional trader !!"
- Started by madank
- Replies: 213
-

-