


D
Written by Dilip Patel
Contact: [email protected]
Lets study how a simple technical indicator is helpful to take a decision:
Simple Moving Average (SMA) of 5 days, 10 days, 30 days and 60 days are being taken into consideration. It is to be kept in mind that this is a lagging indicator.
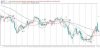
Here is an example of ACC scrip listed in NSE.
*********SORRY CHART (PICTURE) IS on ATTACHMENT FILE---------
A circle shows that 5 days SMA drifts down 10 days SMA and Price is also trading lower of 5 days SMA. This implies that a downturn of share price. At this time, both slower MA trading lower than 30 and 60 days SMA. It confirms the downtrend.
The same opposite case in B circle.
The point C is a confusing one where all SMAs overlap each other. It means the prices are in sideways. Until we get a clear signal, it is riskier to initiate a trade.
The circle D envisages how 5 days SMA first goes down from 10 days SMA and then consequently went down from both 30 and 60 days SMA. The price also traded below all SMA. This is confirmed downtrend pattern.
The Circle E tests your knowledge. The reason is that slower MA & prices crossed early but when the price crossed the 60 days SMA, the upward momentum of price seems exhausted. Here you can take help of a momentum indicator to ascertain at the time of initiating a trade whether momentum of price is strong enough to give you a 20 30 per cent capital appreciation before a downturn comes in card.
Moreover, take the overall chart. From the chart, it says the scrip is in a downtrend. That means, we will not gain much in case you are holding a buy trade. You will have to watch when price reaching 30 days and 60 days SMA which act as resistance. In a historical basis, 200 days moving average is considered as a strong support in a Bull Run and strong resistance in a bear market. Even if price will cross both longer days SMA, it is difficult to sustain at that level. In a downtrend, seller is more active than buyer. Thus, when there is selling, it is much more than expected.
Reading SMAs along with volume is appreciable.
Based on a 5 days SMA crossing 10 days SMA, your buy call may be a dangerous trade, because in several instance, you will find a false signal.
It is quite helpful in a trend market and just hopeless in trading market. Just observe the above chart. Keep observing and you will know the art of trade.
Contact: [email protected]
Lets study how a simple technical indicator is helpful to take a decision:
Simple Moving Average (SMA) of 5 days, 10 days, 30 days and 60 days are being taken into consideration. It is to be kept in mind that this is a lagging indicator.
Here is an example of ACC scrip listed in NSE.
*********SORRY CHART (PICTURE) IS on ATTACHMENT FILE---------
A circle shows that 5 days SMA drifts down 10 days SMA and Price is also trading lower of 5 days SMA. This implies that a downturn of share price. At this time, both slower MA trading lower than 30 and 60 days SMA. It confirms the downtrend.
The same opposite case in B circle.
The point C is a confusing one where all SMAs overlap each other. It means the prices are in sideways. Until we get a clear signal, it is riskier to initiate a trade.
The circle D envisages how 5 days SMA first goes down from 10 days SMA and then consequently went down from both 30 and 60 days SMA. The price also traded below all SMA. This is confirmed downtrend pattern.
The Circle E tests your knowledge. The reason is that slower MA & prices crossed early but when the price crossed the 60 days SMA, the upward momentum of price seems exhausted. Here you can take help of a momentum indicator to ascertain at the time of initiating a trade whether momentum of price is strong enough to give you a 20 30 per cent capital appreciation before a downturn comes in card.
Moreover, take the overall chart. From the chart, it says the scrip is in a downtrend. That means, we will not gain much in case you are holding a buy trade. You will have to watch when price reaching 30 days and 60 days SMA which act as resistance. In a historical basis, 200 days moving average is considered as a strong support in a Bull Run and strong resistance in a bear market. Even if price will cross both longer days SMA, it is difficult to sustain at that level. In a downtrend, seller is more active than buyer. Thus, when there is selling, it is much more than expected.
Reading SMAs along with volume is appreciable.
Based on a 5 days SMA crossing 10 days SMA, your buy call may be a dangerous trade, because in several instance, you will find a false signal.
It is quite helpful in a trend market and just hopeless in trading market. Just observe the above chart. Keep observing and you will know the art of trade.
Attachments
-
 38.1 KB Views: 127
Last edited by a moderator: