Teach A Man To Fish And.........

Status
Not open for further replies.
HI SAINT AND TRADER 123,

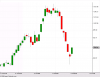
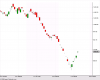
There is a difference in your weekly charts. The difference is around july 2004. In saints chart there is no major fall but trader in your chart there is a long black candle. The fall could be cause of a split or x bonus. I do not know. Maybe that would also make a difference in drawing the trendline. I am not sure. I have not seen if the fall has made us shift the trendline a bit lower. I saw on the charts of BSEINDIA.com and the long black candle was there. So it might be cause of a split or bonus.

Rgds

Rahul
 
Saint said:
Hi Gobatman2001,

Always better to have both the weekly and daily in line before attempting to go long.No problems actually if you are an adept hand at this........else,stay clear of this rally till the intermediate trends give you a signal to go long.

Just posting BOM DYE chart....

All the best!
Saint
Hi! Saint,

Many thanks for your reply. I am not getting into any trades at this point of time. Thanks to your "brilliant" thread, I have been going through a lot of charts.

My query was totally from an educational point of view.

The reason why I am confused is that many a times, if you keep referring to the daily charts, you tend to miss the big rallies. And many a times, if you refer to the weekly charts, you lose a lot of your profits (if there is a downtrend in the daily charts). This is what is bothering me. :confused: :confused: :confused:

Thanks a million for everything!
 
Anupama Singh said:
Hello Saint!

At what stage in a intermediate downtrend do we say that we are in a bear market
?

How do we make out the difference between a major trend move and an intermediate trend move?

Please take your time in answering,maybe over the weekend.

Thanks!
Regards!
Anu
Anu
Good question ...

If you read carefully thru Saint’s posts http://www.traderji.com/38797-post21.html and http://www.traderji.com/38972-post36.html you may get your answer

Anyway, pending Saint’s response to your query, and adding to Munchikana's clarification of 16th, here is my take :

(Re your query 1) I doubt if any one can say for sure before the completion of the subsequent pullback (rally), and maybe even the subsequent down leg

If in that rally, the previous high gets crossed, then the downtrend was an intermediate downturn, and we are still in a bull market (thus if u look at real life, sensex needs to gain another 2500 points b4 we can say for sure we remain in a bull market. see chart, updated till y'day, for ready reference http://finance.yahoo.com/q/bc?s=%5EBSESN&t=3m&l=on&z=l&q=l&c=)

If, on the other hand, the previous high does not get crossed, AND the next downtrend breaches the previous low, we are in a bear market (thus if the June 12th ? low of around 9000 gets breached again ... if and when a downtrend resumes... we can say we have been in a bear market since early May)

Re your second query : Major trend moves last typically some years, whereas intermediates get over in weeks or a couple of mths.


Hope this helps

AGILENT:)

PS If you have the time and the interest, pl read some standard TA book, e.g. 'TA of stock trends' by Edwards & Magee
 
Saint said:
So,in an uptrend,we have HIGHER PIVOT LOWS.How did we come to that?Each pivot low is higher than the previous pivot low.Therefore we call it higher pivot lows.

In a downtrend,we have LOWER PIVOT HIGHS.How did we come to that?Each pivot high is lower than the previous pivot high.Therefore we call it lower pivot highs.
Hi Saint,

I have two questions reading through your posts multiple times...

Question 1.
In the above quote you say that a uptrend is caused by a series of higher pivot lows. Is it correct to say that in an uptrend we also have a series of higher pivot highs ? The same in converse for a downtrend?

Question 2.
For a given time period, is it a rule that you have only one trendline? Basically what are the rules of drawing a trend lines? Is there any rule on how to draw a trendline or we look in the charts and connect multiple highs/lows to form the trendlines?

Thanks a ton for your answers and once again appreciate your efforts to enlighten folks like me with your brilliant teaching.

PS : Between 7th June and 13th June I was in a frenzy of buying stocks and I stopped buying the day I started reading your thread:confused: Now it makes sense to me why I am not making any profits but am sure I will learn a lot from your efforts.

Regards
Satish
 
Hello Saint,

I have another question. I am tearing my hair apart to understand this chart. Please have a look at the attached weekly chart of ITD Cementation. Clearly in the last three days there is a Pivot Low on 16th June. The daily charts show this is in a rally for the past four days. The downtrend is in question but we do not have a confirmation of the uptrend. How long do we wait till we make our move? As far as I understand from your previous posts, we only flag this stock onto our watch list. We wait till it makes a higher pivot low and higher pivot high. Lets say in the daily charts it makes a pivot low in the area above the current pivot low 522.70. Things are better and better. But the previous pivot high is in the range of 900. Do we have to wait until this pivot high is taken out? What if the rally does'nt stop? Don't we loose out if we do not buy it early? Sorry for so many questions but hope you get my point.

Regards

Satish
 

Attachments

satish_goteti said:
Hello Saint,

I have another question. I am tearing my hair apart to understand this chart. Please have a look at the attached weekly chart of ITD Cementation. Clearly in the last three days there is a Pivot Low on 16th June. The daily charts show this is in a rally for the past four days. The downtrend is in question but we do not have a confirmation of the uptrend. How long do we wait till we make our move? As far as I understand from your previous posts, we only flag this stock onto our watch list. We wait till it makes a higher pivot low and higher pivot high. Lets say in the daily charts it makes a pivot low in the area above the current pivot low 522.70. Things are better and better. But the previous pivot high is in the range of 900. Do we have to wait until this pivot high is taken out? What if the rally does'nt stop? Don't we loose out if we do not buy it early? Sorry for so many questions but hope you get my point.

Regards

Satish
Hi Saint,

I had a question related to his query. Will be take the 900 mark as a pivot high as what I have learned so far and read in dow theory and by martin pring is that a pivot is made if a it retraces 33%, 50% or 66%. Now if we take other theories as well 12.5% is minimum retracement levels we take. In this case if take the high of 19th april, the move around 24th may was a mere sidway movement and not a retracement to qualify as a new pivot point.

Pls comment on the same and corrrect me if i have misunderstood the concept of a pivot.

Rgds

Rahul

P.S and yes it would be nice to see an answer to his question to as when would u enter this trade.
 
This thread is really useful for a novice like me, Thanks Saint youre doing an excellent job, God bless you and thanks to satish Goteti for recommending this link
 
satish_goteti said:
Hi Saint,

I have two questions reading through your posts multiple times...

Question 1.
In the above quote you say that a uptrend is caused by a series of higher pivot lows. Is it correct to say that in an uptrend we also have a series of higher pivot highs ? The same in converse for a downtrend?

Question 2.
For a given time period, is it a rule that you have only one trendline? Basically what are the rules of drawing a trend lines? Is there any rule on how to draw a trendline or we look in the charts and connect multiple highs/lows to form the trendlines?

Thanks a ton for your answers and once again appreciate your efforts to enlighten folks like me with your brilliant teaching.

PS : Between 7th June and 13th June I was in a frenzy of buying stocks and I stopped buying the day I started reading your thread:confused: Now it makes sense to me why I am not making any profits but am sure I will learn a lot from your efforts.

Regards
Satish
Hi Satish,

Thank you for your kind words,Satish......

Question 1:Yep,Satish....every uptrend would be characterised by higher pivot lows and higher pivot highs,and vice versa for the dntrends characterised by lower pivot highs and lows........to know that is important in detecting the trend.BUT,in an uptrend,focus on the higher pivot lows and vice versa on lower pivot highs in the dntrend.....Why?More to do with where to place your stops and to know when this current trend is over.So,basically every pivot low goes on to make a higher pivot high and then a higher pivot low followed by a higher pivot high.As said before,this stock is in an uptrend.When do we say that this particular up move is over.......When a previous pivot low is taken out.

Therefore,in an uptrend,train your eye to focus on the higher pivot lows.....So too in a dntrend,train your eye to focus on the lower pivot highs.A crack of a previous pivot low on a weekly chart indicates that this up move is over.Vice versa in a dntrend.....

All the best!
Saint
 
Question 2.
For a given time period, is it a rule that you have only one trendline? Basically what are the rules of drawing a trend lines? Is there any rule on how to draw a trendline or we look in the charts and connect multiple highs/lows to form the trendlines?
Hi Satish,

Think the below chart explains itself.......feel free to ask though if something is not clear.

Saint
 
Last edited:
dominicsp said:
This thread is really useful for a novice like me, Thanks Saint youre doing an excellent job, God bless you and thanks to satish Goteti for recommending this link
Thank you for your warm remarks,Dominic....

Saint
 
Status
Not open for further replies.

Similar threads