View attachment 25905
This weekend we take up ERL which I found to be most misunderstood and wrongly used part of this method.
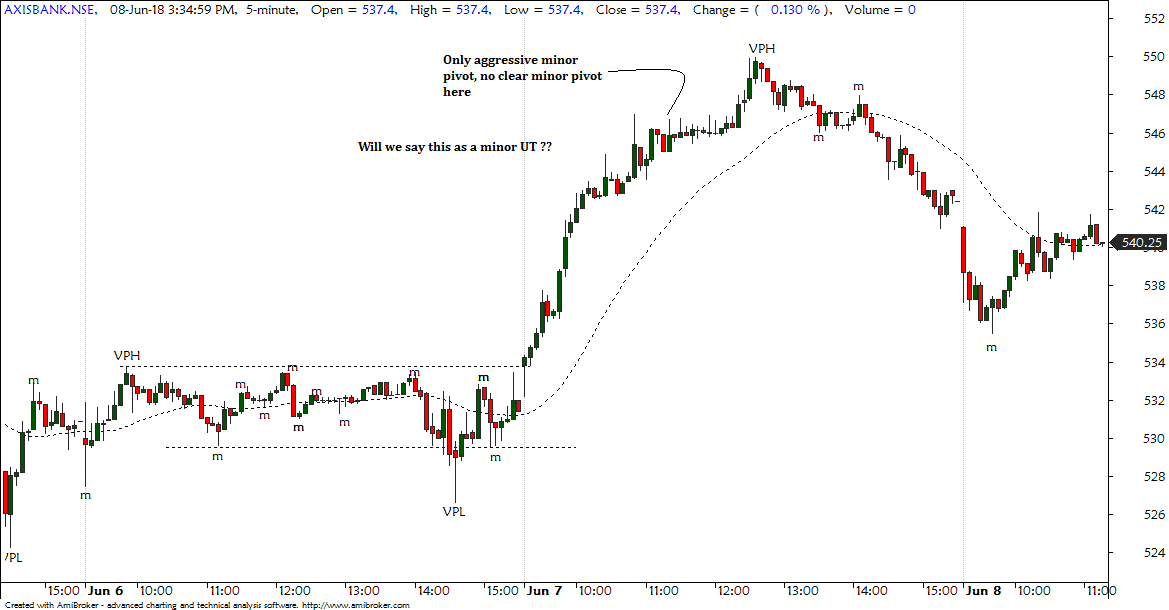
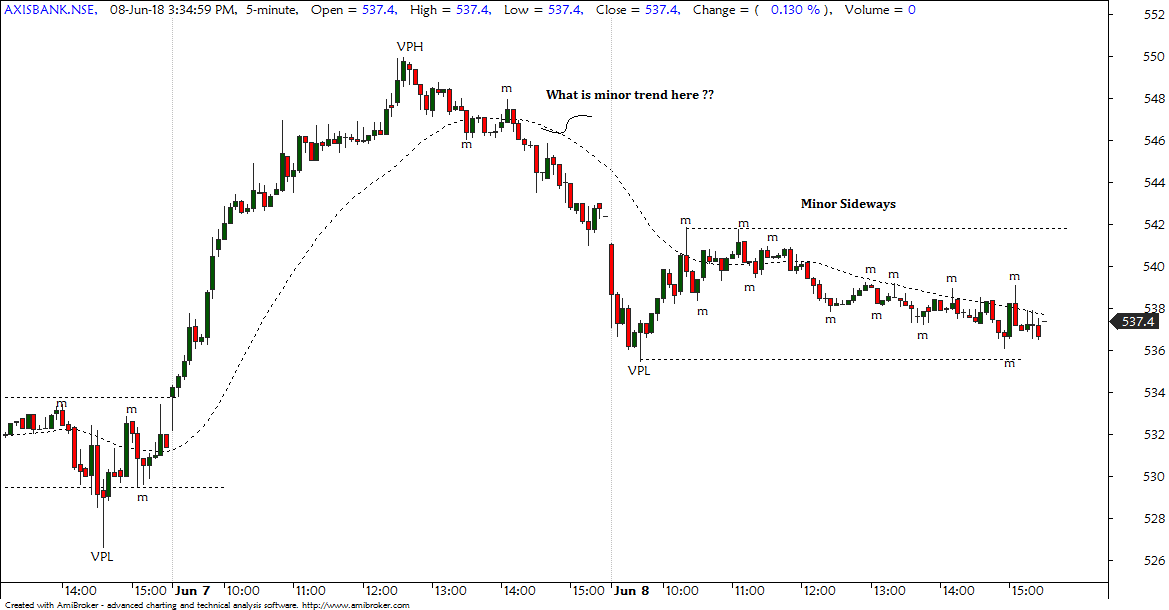
ERL is Early Reversal Line and it serves a purpose of indicating early reversal of a trend. To give some theory on why is ERL necessary ?? ERL helps to avoid the false trades taken on pivots when the market does a flag type small correction or ABC type correction and gives a false impression of trend change. It has been onserved that most flags do not go above ERL and hence if the markets pivots above ERL in downtrend and then proceeds to break that pivot high ( point B in our hart) then there is a good probability that the downtrend is changing into uptrend.
Some cardinal rules about ERLs :
1) ERLs are horriontal lines ( in case of derl they are slanting up or down ) drawn from body pivot low in a downtrend and body pivot highs in an uptrend.
2)
For ERLs make sure that at those points the market has atleast momentarily changed the direction . I have seen people drawing ERLs from inside bars or small sideways bars which is not a change of direction of the price move.
3) ERLs from the latest trend are to be considered. ERL lines need to be clean....these statements need more of observation and understanding from traders.When ERL lines are not clean then that ERL is from the previous trend which is not to be considered.
4) Once an ERL is drawn,
the price has to close above the ERL in case of downtrend and below the ERL in case of uptrends.ERL is NOT operative till the price not only closes above it but also has gone visual distance above the ERL.....this is important. If the price just pierces ERL and comes down below it then it is a case of Rejection/failure and NOT ERL reversal.....
5) We are more strict in case of reversal from downtrend to uptrend. This is because uptrend has to travel against the gravity and owntrend travels with the gravity....so we need a mPH above ERL in case of downtrend reversing to uptrend. In case of uptrend reversing to downtrend we need only bar to close below ERL and have visual distance.....below that bar we go short assuming trend reversal from up to downtrend.
6) Area obove ERL in case of downtrend reversing to uptrend is called
Definative Area.....market has to trade above definative area for trend change to uptrend.
7) ERLs are to be used in a trend...
NOT to be used in a sideways market. In sideways, it will go on printing ERLs after ERLs and is meaningless.
8) ERLs are to be used after a price move has played out sufficiently.I have seen traders start looking for ERL reversal after the correction which comes after a first rally.....this is the source of most wrong trades.
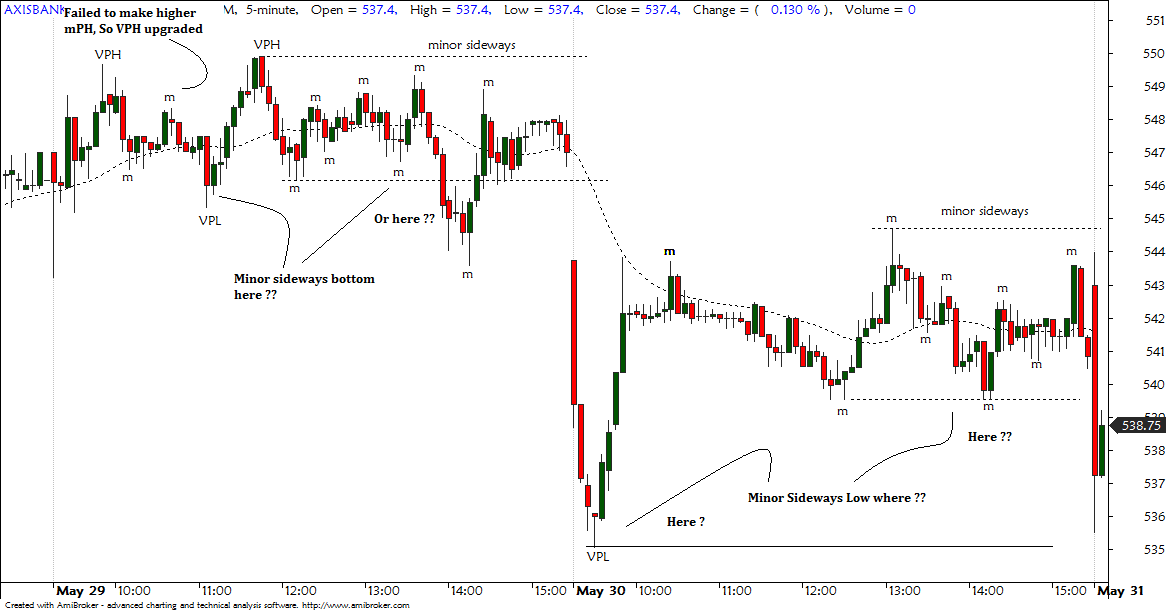
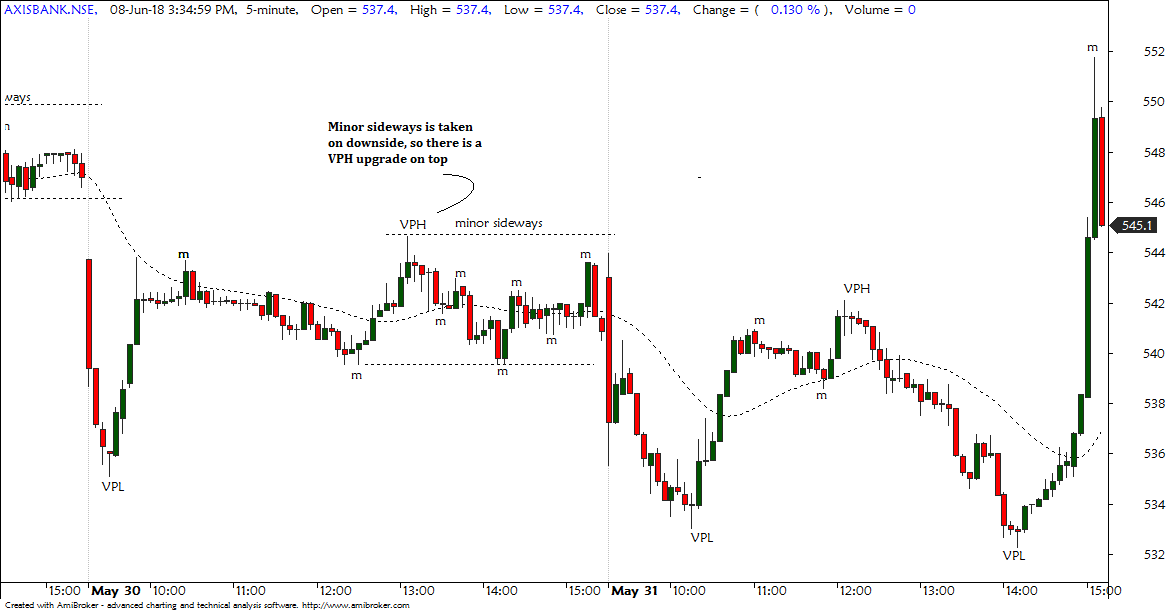
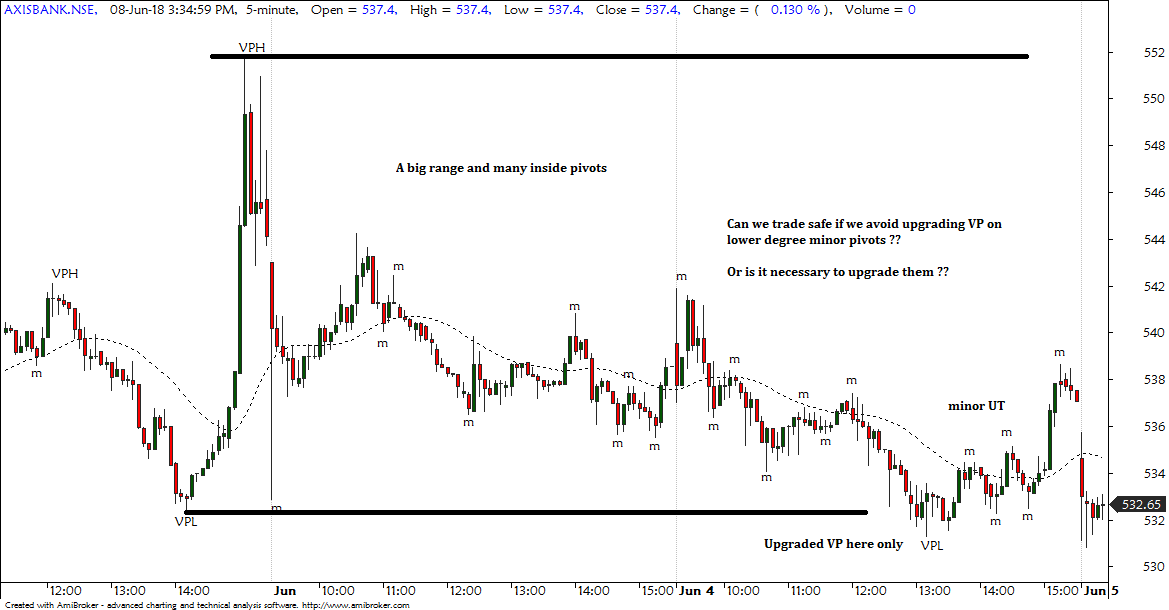
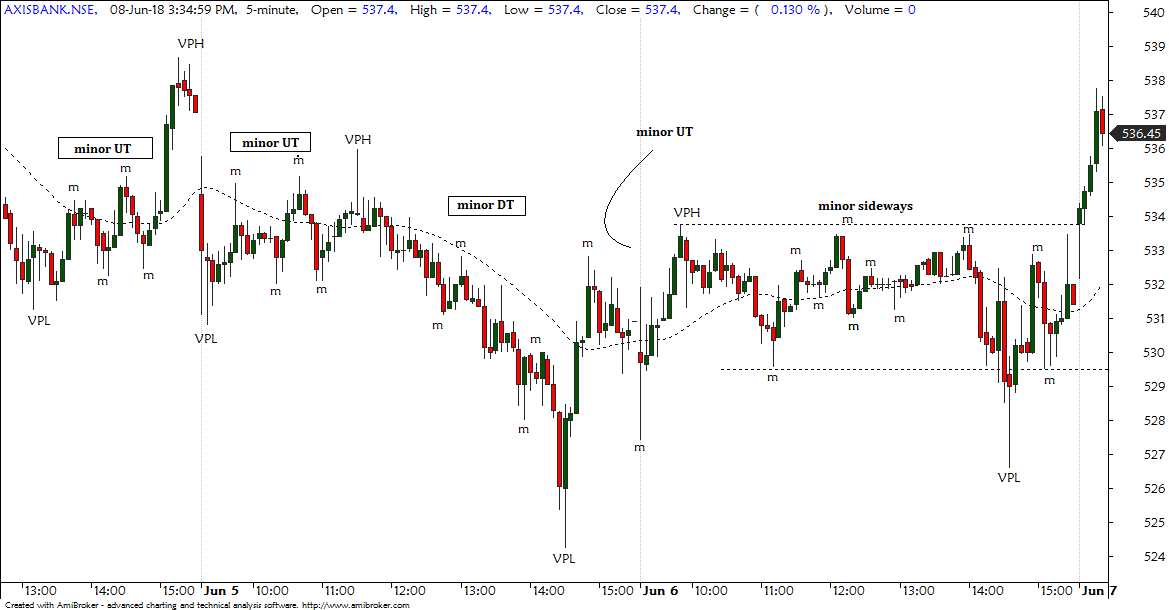
9) A very important use of ERLs are in pivot upgradation....observe that point B is a mPH above ERL......then C comes down and closes below ERL...so point B gets upgraded to VPH ( earlier it was mPH) similarly point C when the market closed again above ERL , gets upgraded to VPL ( it was a mph earlier) ..so now we have VPH,VPL and price breaking VPH above definative area and that is strong possibility of trend reversal to UP.....
ERLs drwn from visual pivots are known as visual erls (VERLs) and ERLs drawn from minor pivots are known as minor ERLs,
For pivot upgradation, refer to few early pages where Subhdip has nicely explained the concept with charts.
I have posted a 3 min Bajaj Finance chart to illustrate the concepts we talked above. The chart is self explanatory...the red horrizontal line is an ERL, in a ongoing visual downtrend......
This concept needs chart observation and understanding.....it will take time to sink in.....but ERL is a very powerful concept in pivot method.
Smart_trade