


- Joined
- Dec 13, 2011
- Messages
- 731
- Likes
- 1,216
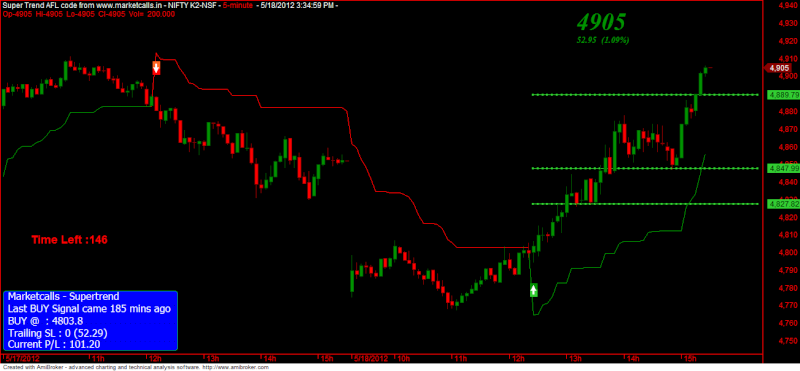
Super Trend Indicator
Code:
_SECTION_BEGIN("SuperTrend");
SetBarsRequired(100000,0);
GraphXSpace = 15;
SetChartOptions(0,chartShowArrows|chartShowDates);
SetChartBkColor(ParamColor("bkcolor",ColorRGB(0,0, 0)));
GfxSetBkMode(0);
GfxSetOverlayMode(1);
SetBarFillColor(IIf(C>O,ParamColor("Candle UP Color", colorGreen),IIf(C<=O,ParamColor("Candle Down Color", colorRed),colorLightGrey)));
Plot(C,"\nPrice",IIf(C>O,ParamColor("Wick UP Color", colorDarkGreen),IIf(C<=O,ParamColor("Wick Down Color", colorDarkRed),colorLightGrey)),64,0,0,0,0);

SetTradeDelays(1,1,1,1);


//////////////////////////////////////////
//Calculates Seconds Left for New Bar  //
/////////////////////////////////////////


function GetSecondNum()
{
Time = Now( 4 );
Seconds = int( Time % 100 );
Minutes = int( Time / 100 % 100 );
Hours = int( Time / 10000 % 100 );
SecondNum = int( Hours * 60 * 60 + Minutes * 60 + Seconds );
return SecondNum;
}
RequestTimedRefresh( 1 );
TimeFrame = Interval();
SecNumber = GetSecondNum();
Newperiod = SecNumber % TimeFrame == 0;
SecsLeft = SecNumber - int( SecNumber / TimeFrame ) * TimeFrame;
SecsToGo = TimeFrame - SecsLeft;

x=Param("xposn",50,0,1000,1);
y=Param("yposn",380,0,1000,1);

GfxSelectSolidBrush( ColorRGB( 230, 230, 230 ) );
GfxSelectPen( ColorRGB( 230, 230, 230 ), 2 );
if ( NewPeriod )
{
GfxSelectSolidBrush( colorYellow );
GfxSelectPen( colorYellow, 2 );
Say( "New period" );
}
//GfxRoundRect( x+45, y+40, x-3, y-2, 0, 0 );
//GfxSetBkMode(1);
GfxSelectFont( "Arial", 14, 700, False );
GfxSetTextColor( colorRed );
GfxTextOut( "Time Left :"+SecsToGo+"", x, y );

////////////////////////////////////////////


_N(Title = StrFormat("{{NAME}} - {{INTERVAL}} {{DATE}} Open %g, Hi %g, Lo %g, Close %g (%.1f%%) {{VALUES}}", O, H, L, C, SelectedValue( ROC( C, 1 ) ) ));

Factor=Param("Factor",4,1,10,1);
Pd=Param("ATR Periods",6,1,100,1);
Up=(H+L)/2+(Factor*ATR(Pd));
Dn=(H+L)/2-(Factor*ATR(Pd));
iATR=ATR(Pd);
TrendUp=TrendDown=Null;
trend[0]=1;
changeOfTrend=0;
flag=flagh=0;

for (i = 1; i <BarCount-1; i++) {
      TrendUp[i] = Null;
      TrendDown[i] = Null;

      trend[i]=1;


      if (Close[i]>Up[i-1]) {
        trend[i]=1;
        if (trend[i-1] == -1) changeOfTrend = 1;

      }
      else if (Close[i]<Dn[i-1]) {
        trend[i]=-1;
        if (trend[i-1] == 1) changeOfTrend = 1;
      }
      else if (trend[i-1]==1) {
        trend[i]=1;
        changeOfTrend = 0;
      }
      else if (trend[i-1]==-1) {
        trend[i]=-1;
        changeOfTrend = 0;
      }

      if (trend[i]<0 && trend[i-1]>0) {
        flag=1;
      }
      else {
        flag=0;
      }

      if (trend[i]>0 && trend[i-1]<0) {
        flagh=1;
      }
      else {
        flagh=0;
      }

      if (trend[i]>0 && Dn[i]<Dn[i-1]){
        Dn[i]=Dn[i-1];
      }

      if (trend[i]<0 && Up[i]>Up[i-1])
        { Up[i]=Up[i-1];
      }

      if (flag==1)
      {  Up[i]=(H[i]+L[i])/2+(Factor*iATR[i]);;
        }
      if (flagh==1)
        { Dn[i]=(H[i]+L[i])/2-(Factor*iATR[i]);;
        }
      if (trend[i]==1) {
        TrendUp[i]=Dn[i];
        if (changeOfTrend == 1) {
            TrendUp[i-1] = TrendDown[i-1];
            changeOfTrend = 0;
        }
      }
      else if (trend[i]==-1) {
        TrendDown[i]=Up[i];
        if (changeOfTrend == 1) {
            TrendDown[i-1] = TrendUp[i-1];
            changeOfTrend = 0;
        }
      }
  }

Plot(TrendUp,"Trend",colorGreen);
Plot(TrendDown,"Down",colorRed);

Buy = trend==1;
Sell=trend==-1;

Buy=ExRem(Buy,Sell);
Sell=ExRem(Sell,Buy);
Short=Sell;
Cover=Buy;


BuyPrice=ValueWhen(Buy,C);
SellPrice=ValueWhen(Sell,C);
ShortPrice=ValueWhen(Short,C);
CoverPrice=ValueWhen(Cover,C);


Title = EncodeColor(colorWhite)+ "Super Trend AFL code from www.marketcalls.in" + " - " +  Name() + " - " + EncodeColor(colorRed)+ Interval(2) + EncodeColor(colorWhite) +
 "  - " + Date() +" - "+"\n" +EncodeColor(colorRed) +"Op-"+O+"  "+"Hi-"+H+"  "+"Lo-"+L+"  "+
"Cl-"+C+"  "+ "Vol= "+ WriteVal(V)+"\n"+
EncodeColor(colorLime)+
WriteIf (Buy , " GO LONG / Reverse Signal at "+C+"  ","")+
WriteIf (Sell , " EXIT LONG / Reverse Signal at "+C+"  ","")+"\n"+EncodeColor(colorYellow)+
WriteIf(Sell , "Total Profit/Loss for the Last Trade Rs."+(C-BuyPrice)+"","")+
WriteIf(Buy  , "Total Profit/Loss for the Last trade Rs."+(SellPrice-C)+"","");

PlotShapes(IIf(Buy, shapeSquare, shapeNone),colorGreen, 0, L, Offset=-40);
PlotShapes(IIf(Buy, shapeSquare, shapeNone),colorLime, 0,L, Offset=-50);
PlotShapes(IIf(Buy, shapeUpArrow, shapeNone),colorWhite, 0,L, Offset=-45);
PlotShapes(IIf(Short, shapeSquare, shapeNone),colorRed, 0, H, Offset=40);
PlotShapes(IIf(Short, shapeSquare, shapeNone),colorOrange, 0,H, Offset=50);
PlotShapes(IIf(Short, shapeDownArrow, shapeNone),colorWhite, 0,H, Offset=-45);

TrendSL=IIf(trend==1,TrendUp,TrendDown);

for(i=BarCount-1;i>1;i--)
{
if(Buy[i] == 1)
{
entry = C[i];
sig = "BUY";
sl = TrendSL[i];
tar1 = entry + (entry * .0050);
tar2 = entry + (entry * .0092);
tar3 = entry + (entry * .0179);

bars = i;
i = 0;
}
if(Sell[i] == 1)
{
sig = "SELL";
entry = C[i];
sl = TrendSL[i];
tar1 = entry - (entry * .0050);
tar2 = entry - (entry * .0112);
tar3 = entry - (entry * .0212);


bars = i;
i = 0;
}
}
Offset = 20;
Clr = IIf(sig == "BUY", colorLime, colorRed);
ssl = IIf(bars == BarCount-1, TrendSL[BarCount-1], Ref(TrendSL, -1));
sl = ssl[BarCount-1];


Plot(LineArray(bars-Offset, tar1, BarCount, tar1,1), "", Clr, styleLine|styleDots, Null, Null, Offset);
Plot(LineArray(bars-Offset, tar2, BarCount, tar2,1), "", Clr, styleLine|styleDots, Null, Null, Offset);
Plot(LineArray(bars-Offset, tar3, BarCount, tar3,1), "", Clr, styleLine|styleDots, Null, Null, Offset);

//Plot(LineArray(bars-Offset, sl, BarCount, sl,1), "", colorDarkRed, styleLine|styleLine, Null, Null, Offset);
//Plot(LineArray(bars-Offset, entry, BarCount, entry,1), "", colorGreen, styleLine|styleLine, Null, Null, Offset);

/*
for (i=bars; i <BarCount;i++)
{
PlotText(""+sig+"@"+entry, BarCount-5,entry,Null,colorBlue);
PlotText("T1@"+tar1,BarCount-5,tar1,Null,Clr);PlotText("T2@"+tar2,BarCount-5,tar2,Null,Clr);PlotText ("T3@"+tar3,BarCount-5,tar3,Null,Clr);

}*/

messageboard = ParamToggle("Message Board","Show|Hide",1);
if (messageboard == 1 )
{
GfxSelectFont( "Tahoma", 13, 100 );
GfxSetBkMode( 1 );
GfxSetTextColor( colorWhite );

if ( sig =="BUY")
{
GfxSelectSolidBrush( colorBlue ); // this is the box background color
}
else
{
GfxSelectSolidBrush( colorRed ); // this is the box background color
}
pxHeight = Status( "pxchartheight" ) ;
xx = Status( "pxchartwidth");
Left = 1100;
width = 310;
x = 5;
x2 = 290;

y = pxHeight;

GfxSelectPen( colorGreen, 1); // broader color
GfxRoundRect( x, y - 98, x2, y , 7, 7 ) ;
GfxTextOut( ( "Marketcalls - Supertrend"),13,y-100);
GfxTextOut( (" "),27,y-100);
GfxTextOut( ("Last " + sig + " Signal came " + (BarCount-bars-1) * Interval()/60 + " mins ago"), 13, y-80) ; // The text format location
GfxTextOut( ("" + WriteIf(sig =="BUY",sig + " @ ",sig + " @") + " : " + entry), 13, y-60);
GfxTextOut( ("Trailing SL : " + TrendSL + " (" + WriteVal(IIf(sig == "SELL",entry-sl,sl-entry), 2.2) + ")"), 13, y-40);
/*GfxTextOut( ("TGT:1 : " + tar1), 13, y -80);
GfxTextOut( ("TGT:2 : " + tar2), 13,y-60);
GfxTextOut( ("TGT:3 : " + tar3), 13,y-40);*/
GfxTextOut( ("Current P/L : " + WriteVal(IIf(sig == "BUY",(C-entry),(entry-C)),2.2)), 13, y-22);;


//Magfied Market Price
FS=Param("Font Size",30,11,100,1);
GfxSelectFont("Times New Roman", FS, 700, True );
GfxSetBkMode( colorWhite );
GfxSetTextColor( ParamColor("Color",colorGreen) );
Hor=Param("Horizontal Position",940,1,1200,1);
Ver=Param("Vertical Position",12,1,830,1);
GfxTextOut(""+C, Hor , Ver );
YC=TimeFrameGetPrice("C",inDaily,-1);
DD=Prec(C-YC,2);
xx=Prec((DD/YC)*100,2);
GfxSelectFont("Times New Roman", 11, 700, True );
GfxSetBkMode( colorBlack );
GfxSetTextColor(ParamColor("Color",colorYellow) );
GfxTextOut(""+DD+"  ("+xx+"%)", Hor , Ver+45 );

}

_SECTION_END();
/*
_SECTION_BEGIN("Time Left");
function GetSecondNum()
{
Time = Now( 4 );
Seconds = int( Time % 100 );
Minutes = int( Time / 100 % 100 );
Hours = int( Time / 10000 % 100 );
SecondNum = int( Hours * 60 * 60 + Minutes * 60 + Seconds );
return SecondNum;
}
RequestTimedRefresh( 1 );
TimeFrame = Interval();
SecNumber = GetSecondNum();
Newperiod = SecNumber % TimeFrame == 0;
SecsLeft = SecNumber - int( SecNumber / TimeFrame ) * TimeFrame;
SecsToGo = TimeFrame - SecsLeft;

x=Param("xposn",50,0,1000,1);
y=Param("yposn",380,0,1000,1);

GfxSelectSolidBrush( ColorRGB( 230, 230, 230 ) );
GfxSelectPen( ColorRGB( 230, 230, 230 ), 2 );
if ( NewPeriod )
{
GfxSelectSolidBrush( colorYellow );
GfxSelectPen( colorYellow, 2 );
Say( "New period" );
}
//GfxRoundRect( x+45, y+40, x-3, y-2, 0, 0 );
//GfxSetBkMode(1);
GfxSelectFont( "Arial", 14, 700, False );
GfxSetTextColor( colorRed );
GfxTextOut( "Time Left :"+SecsToGo+"", x, y );
_SECTION_END(); */