


Intraday Trading for a Living!
- Thread starter faisalmumtaz150
- Start date
// What are trend-lines?
1. My favorite is the descending triangle
These are formed when the stock is in sideways period after a short term uptrend, these have mostly flat base,and a downward sloping trendline
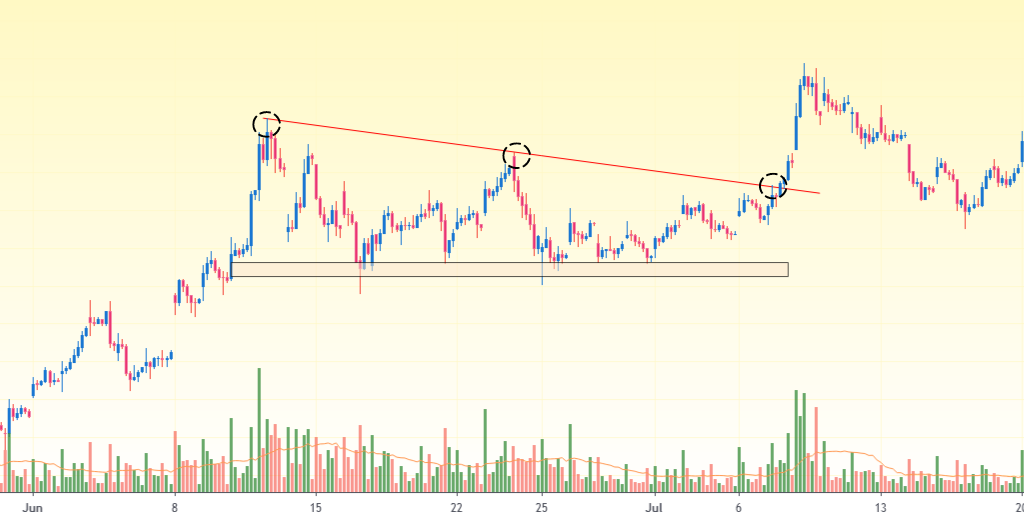
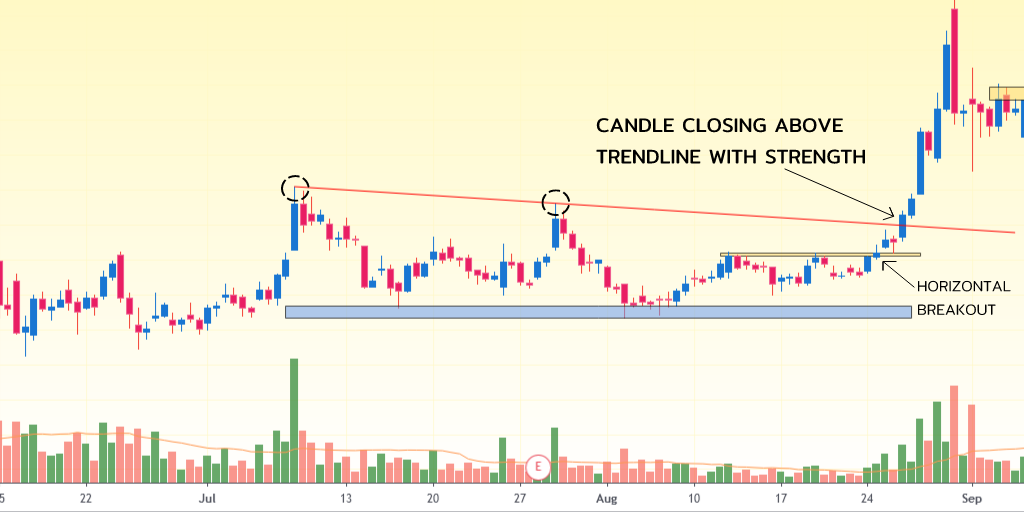
In one example you can see we have 3 points so we have clear point of entry, but in another example we have only 2 major points, so we wait for the breakout candle to close above the trendline to take a trade.

// One tip for this pattern, the steeper the trendline the higher the chance the breakouts will fail, so focus on those patterns which have less steeper trendlines.
Thanks for reading till here .
WHERE TO PUT THE SL-
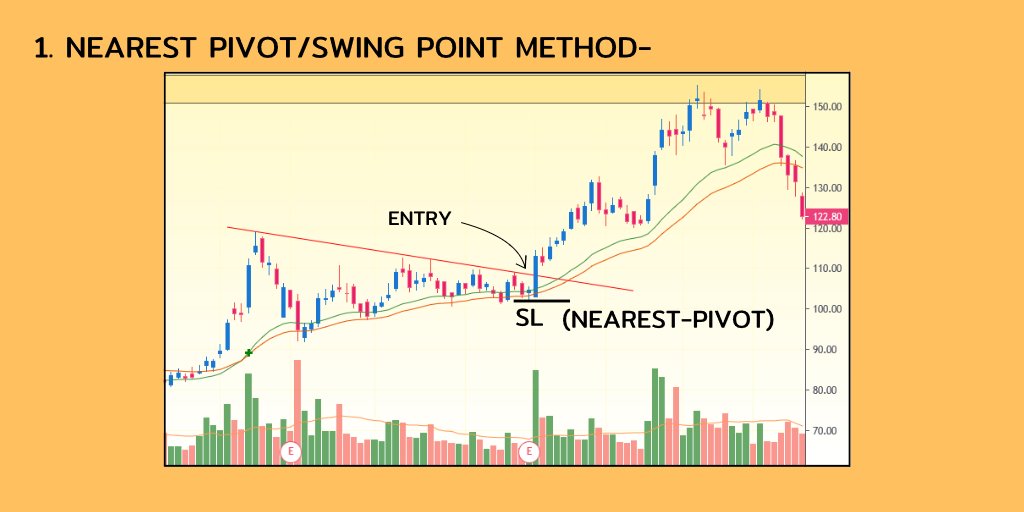
1. NEAREST PIVOT/SWING POINTS-
Normally I use this method for placing sl, In this method we use swing point for placing the SL.
As normally the stock would not try to go below previous swing point if it is to go in our direction.
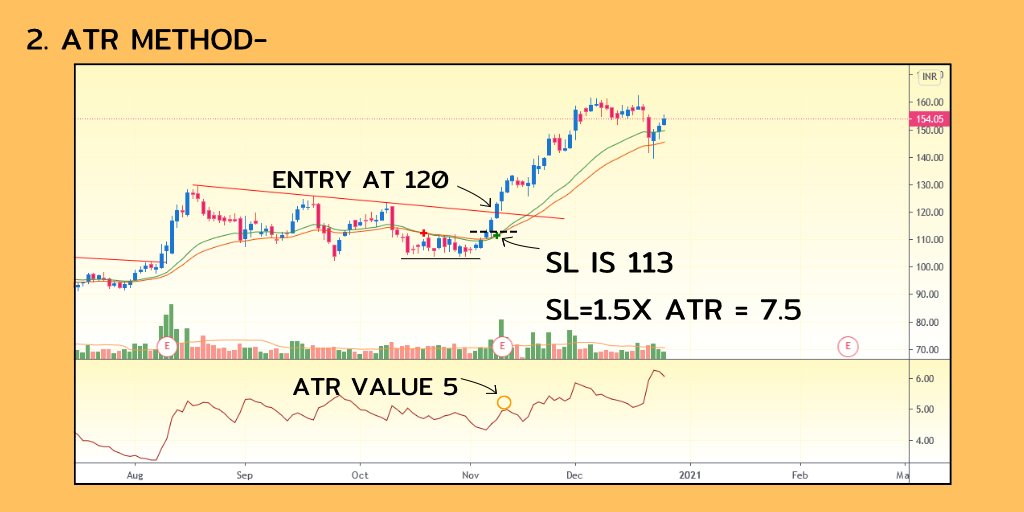
2. ATR method-
Sometimes the Stock do not have any nearest pivot at time of buy, So we use this method as it gives us a level on basis of current volatility of the stock.
I use 1.5 ATR away sl , say the ATR at point of entry is 30, so I place sl
1.5 X, or 45 rs away from entry
In below example the entry is 120, ATR=5, SL= 1.5X ATR= 7.5 OR 113.
Nearest pivot was too far away, that’s why this method is used in these cases.
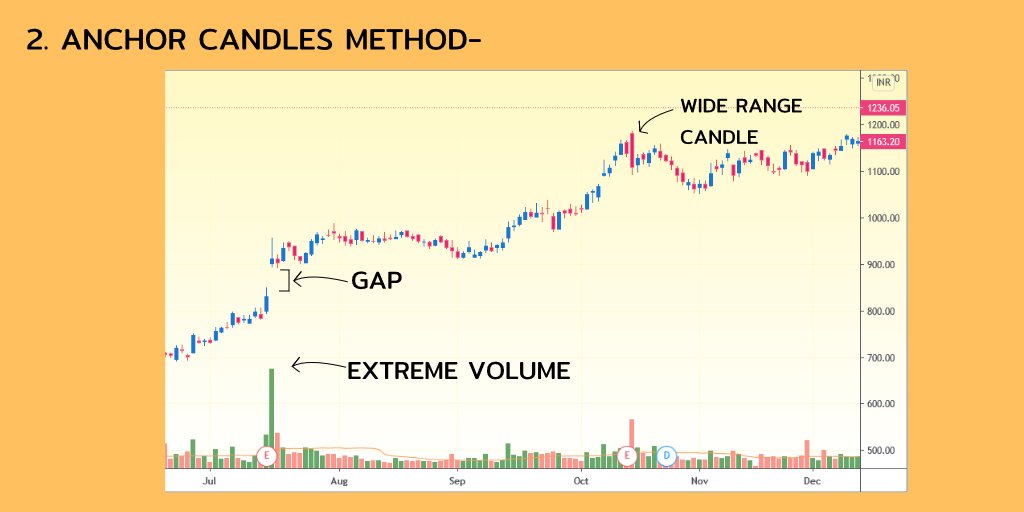
4. Anchor candles-
Anchor bars are those which have extreme Volume, gaps or wide Ranges.
Here, we place our sl below those candles which has the above characteristics.
In below example first we have a gap with high volume, and also a wide range candle both places can be used for placing sl.
In case of gap up , its better to wait for 2-3 candles for confirming.
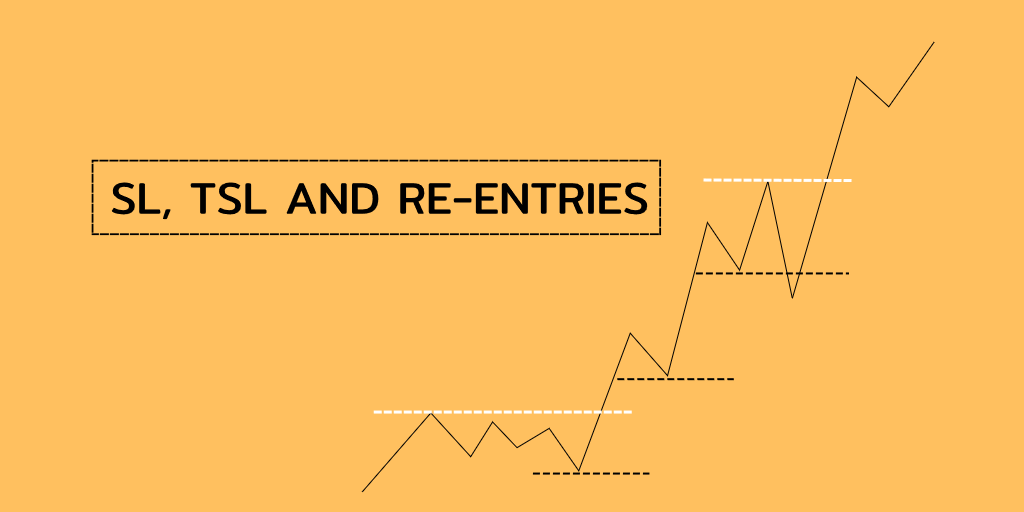
2. TRAILING METHODS-
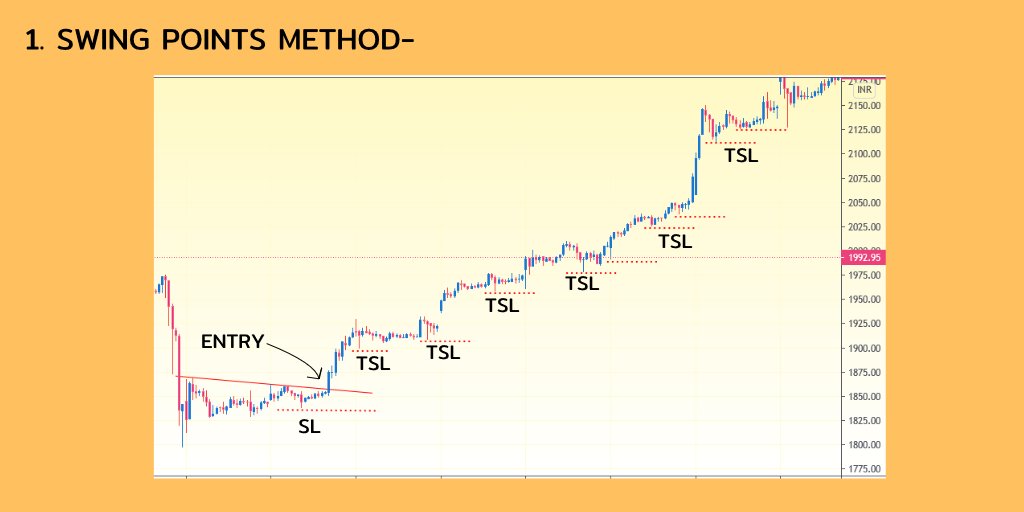
1. SWING POINT METHOD-
In this method we use the swing points or the HH- HL OR LH-LL points for placing sl,
In this method we trail our sl when the stock make a Higher low after our entry and keep Trailing the sl till it hits.
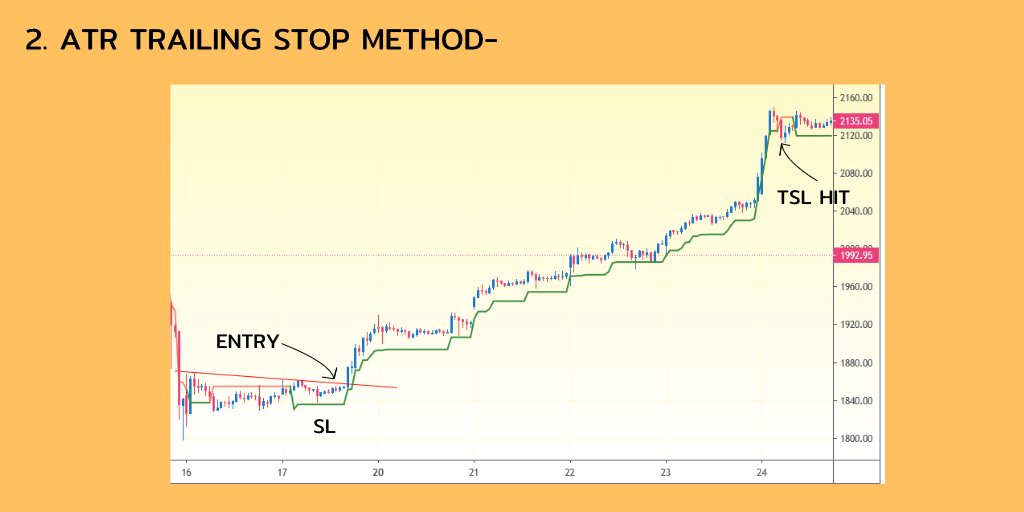
2. ATR TRAILING STOPS-
In this method we use the ATR trailing stop indicator, This method is good as it uses volatility to decide the stop levels.
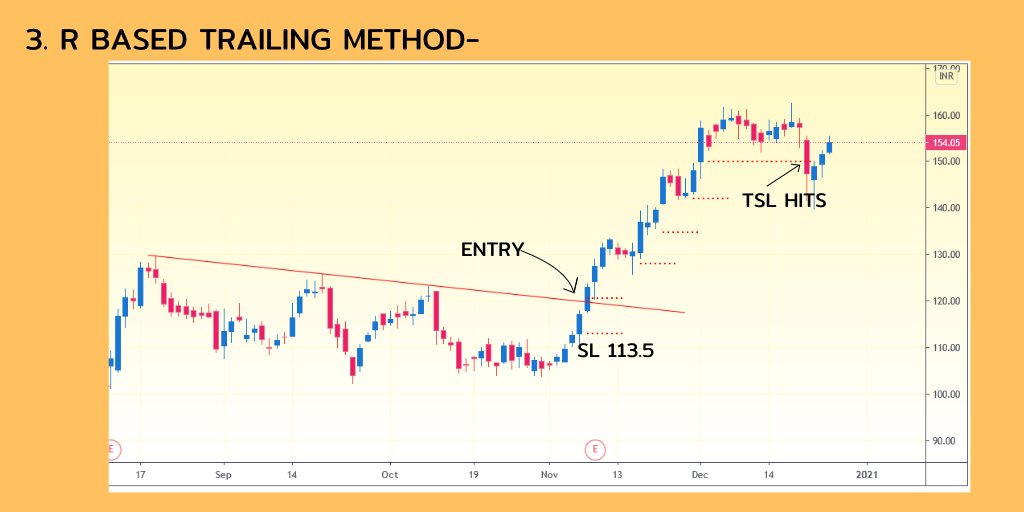
3. R-Based Trail sl-
In this method we increases sl when the instrument increases in our direction the equal amount as our sl.
Say we enter a stock at 500 with sl 490, if the stock moves to 510 we will Trail sl to 500, and so on, till our sl hit.
In below chart entry was 120, sl 113.5 (check prev example), And we trail the sl when stock move 7.5 rs in our direction, and keep doing it till the TSL hit.
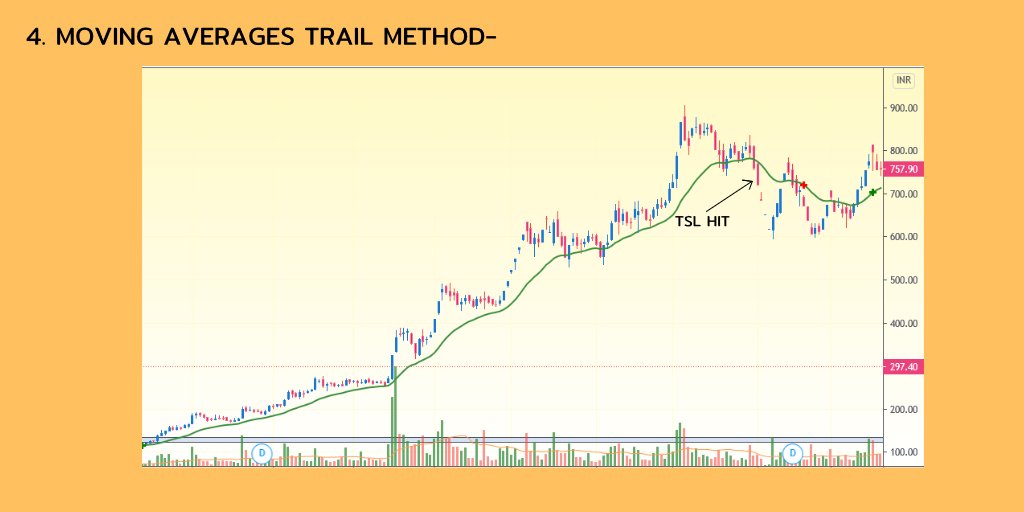
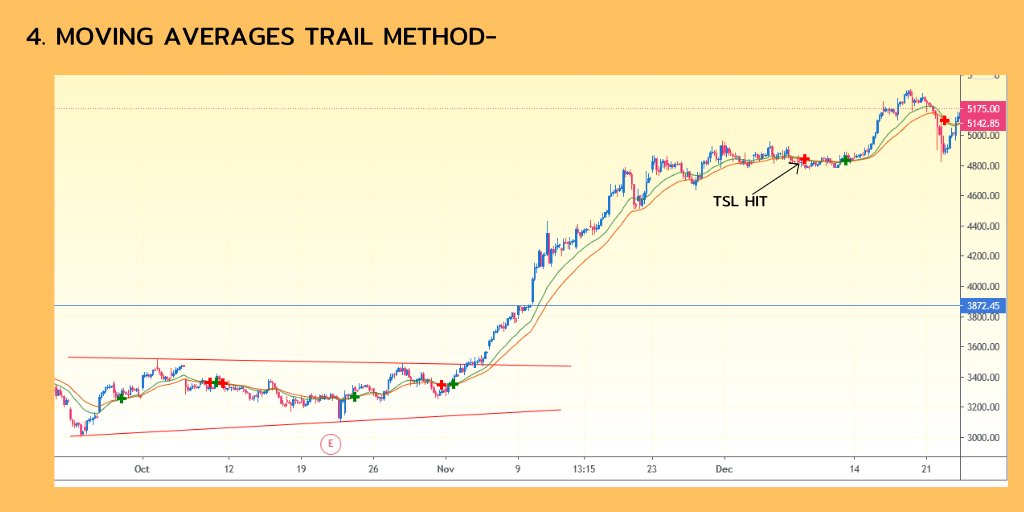
4. MOVING AVERAGES TRAIL METHOD-
In this method we Trail with help of moving averages,
Either we can exit when the 2 consecutive candles closes below the Moving average or we can exit when the moving averages gives crossover.
Ema used in this example are 21,33.
* RE-ENTRIES-
What are re-entries?
When we are Trailing our sl in a stock , sometimes due to high volatility our stop-loss gets hit , but the trend is still intact even after that if the stock make a new high again.
So We again enter the stock if it make a New high .
In below example Our tsl got hit , but the stock didn’t make a lower low and break above the swing high.
For Re- entry sl can be decided according to either the swing point or use ATR or deciding sl.
I use the 1.5 ATR away sl for re-entry.
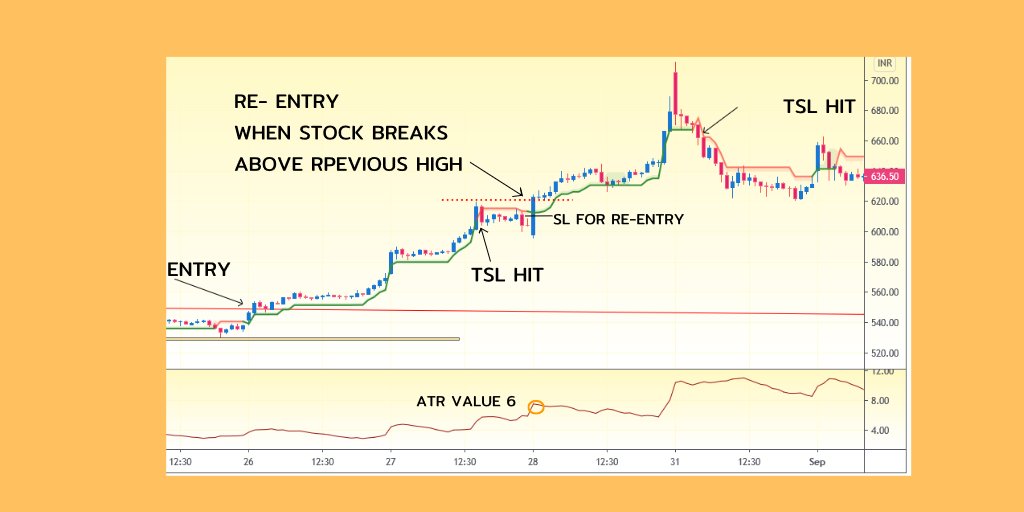
Say ATR at point of re-entry is 6, SL will be 9 points away.
Some points to consider before re-entry which I prefer-
1. I don’t re-enter if I don’t have enough R on my side, atleast 2R should be in my pocket before the re-entry situation occurs.
2. I only Re-enters with the initial qty and not the pyramidid qty.
Say at entry I have 1000 qty and at time of TSL hit I had 5000 qty because of pyramiding, and I get a signal for re-entry I only enter with 1000qty and build the qty again.
These are only my opinions and not necessarily be yours.
One of the basic theory behind gap days.
When underlying gives gap up above yesterday's range and sustains above that for one hour+ means market participants has accepted the new range and are willing to buy at higher price. So fresh buying and short covering are likely.
If price opens gap up out of PDR but fails to hold on to hourly low which means market participants haven't accepted new range yet. So, in that case it's likely to test PDH first if that also doesn't hold then PDC and even PDC doesn't hold price then likely to test PDL.
Similarly, When underlying gives gap down below yesterday's range and sustains below that for one hour+ means market participants has accepted the new range and are willing to sell at lower price. So fresh selling and long unwinding are likely.
If price opens gap down out of PDR but fails to hold on to hourly high which means market participants haven't accepted new range yet. So in that case it's likely to test PDL first if that also doesn't hold then PDC and even PDC doesn't hold price then likely to test PDH.
What is a trade scanner?
A scanner is nothing but a set of buy/sell rules which a trader defines after he/she manually back-test his/her ideas on charts. It is a method to translate your trading ideas into a rule so that you dont need to manually scan in future
There is nothing magical in it but lot of people ask me to share a magical scanner to get 100% solid signals which can change their life. This sort of thing doesn't exist at all. Its a myth to have a scanner giving 100% accurate results.
My scanner may or may not work for you because I built it based on my trade conditions & I look for something specific in a chart before I take a trade. Even if you get the scanner, you may not get the required conviction along with it.
Expectations from a scanner: Not all signals from a scanner can be traded. While it gives you results at high level you are still expected to check charts if it meets all the requirements of a trade & then take a trade. Set right expectations from the scanner. Be reasonable!
Hi faisalmumtaz, thanks for the info laden posts. What are the TFs for the charts you've shown here? And please share some screenng and scanning sites that you found useful.
https://www.screener.in/
https://in.investing.com/stock-screener/
https://in.tradingview.com/screener/
https://chartink.com/screener
The above sites are more than enough which is user friendly as well.
About time frame:
1) The best time frame is daily, No Target only Stop-loss or Trail Stop loss.
2) Every time frame has its own structure so when you do multi TF trading, don't get confused.
Keep things simple:
1) Execution TF (always execute trade on this TF)
2) View forming TF (4-6 times higher than execution)
Example: Execution TF - View TF
5M -30M
15M -75M
1D -5D(1W)
1W -1M
Important points regarding Time Frame:
1) Higher the timeframe, less signals, lesser the noise & better the signal quality. Lower TF, more signals, more noise & thus more false positives. As a concept it works on all TFs.
2) Price Action is King. Works in every market, every instrument, every time frame.
3) There is nothing called best TF. Selection of trading time frame purely depends on how quickly you want results? Intraday TF execution varies between Tick to 15M. Choose whatever works for you.
4) Keep the time frame consistent. These rules are applicable on all time frames, all markets, all instruments.
5) The definition of bullish or bearish varies by time frame. A stock can be BULLISH on daily but can be bearish on 5 minutes TF.
6) Time frame 5min 30min 1hr Daily Weekly Monthly changes. . The combination changes. Investment it is Dly & Mthy while Intraday 5min & 30min.
7) There is nothing called best time frame. Whatever works for you, you should stick to it. In Intraday multiple time frame combination works well.
Sites that are use full for screening:
https://www.screener.in/
https://in.investing.com/stock-screener/
https://in.tradingview.com/screener/
https://chartink.com/screener
The above sites are more than enough which is user friendly as well.
About time frame:
1) The best time frame is daily, No Target only Stop-loss or Trail Stop loss.
2) Every time frame has its own structure so when you do multi TF trading, don't get confused.
Keep things simple:
1) Execution TF (always execute trade on this TF)
2) View forming TF (4-6 times higher than execution)
Example: Execution TF - View TF
5M -30M
15M -75M
1D -5D(1W)
1W -1M
Important points regarding Time Frame:
1) Higher the timeframe, less signals, lesser the noise & better the signal quality. Lower TF, more signals, more noise & thus more false positives. As a concept it works on all TFs.
2) Price Action is King. Works in every market, every instrument, every time frame.
3) There is nothing called best TF. Selection of trading time frame purely depends on how quickly you want results? Intraday TF execution varies between Tick to 15M. Choose whatever works for you.
4) Keep the time frame consistent. These rules are applicable on all time frames, all markets, all instruments.
5) The definition of bullish or bearish varies by time frame. A stock can be BULLISH on daily but can be bearish on 5 minutes TF.
6) Time frame 5min 30min 1hr Daily Weekly Monthly changes. . The combination changes. Investment it is Dly & Mthy while Intraday 5min & 30min.
7) There is nothing called best time frame. Whatever works for you, you should stick to it. In Intraday multiple time frame combination works well.
Similar threads
-
-
What are the best tools or websites for intraday and options trading?
- Started by curiousv
- Replies: 0
-
-
 Some useful tidbits for index intraday trading
- Started by primitivetrader
- Replies: 6