Below is a basic Pivot Code which I use for day trading in Ami. Now the issue is, the pivot lines are drawn only till the current candle which becomes bit difficult to comprehend during live market. Was looking for help if anyone can advise on below.
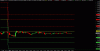
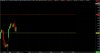
Since Pivot lines remain static for the entire day, need some expert guidance on how to extend the lines till EOD candle even if I see the chart at morning time. I use below code which plots lines till current candle. I want the Line should be visible for the entire day till 3:30PM candle even though I may be seeing the chart at 10:00AM. I.e. the line should be extended till EOD candle on a 5 minute chart or 3 min chart or 15mins chart, the usual timeframes which I use.
I have attached a sample chart to show what I need here.
Any help will be highly appreciated. Thanks in advance.
H1=SelectedValue( TimeFrameGetPrice( "H", inDaily, -1 ));
L1=SelectedValue(TimeFrameGetPrice( "L", inDaily, -1 ));
C1=SelectedValue(TimeFrameGetPrice( "C", inDaily, -1 ));
/*PIVOT Calculation*/
p = ( H1+ L1 + C1 )/3;
s1 = (2*p)-H1;
r1 = (2*p)-L1;
s2 = p -(H1 - L1);
s3 = S1 - (H1-L1);
r2 = p +(H1 - L1);
r3 = R1 +(H1-L1);
Plot (p,"Pivot",colorYellow, styleThick|styleNoRescale, 1);
Plot (r1,"R1",colorRed,styleThick|styleNoRescale, 1);
Plot (r2,"R2",colorRed,styleThick|styleNoRescale, 1);
Plot (r3,"R3",colorRed,styleThick|styleNoRescale,1);
Plot (s1,"S1",colorLime,styleThick|styleNoRescale,1);
Plot (s2,"S2",colorLime,styleThick|styleNoRescale,1);
Plot (s3,"S3",colorLime,styleThick|styleNoRescale,1);
Attachments
-
 179.1 KB Views: 195
")