


TechViews
- Thread starter karthikmarar
- Start date
") HOWEVER Thks Darsh.
HOWEVER Thks Darsh.
RPL - A stock to watch ... any views
But have to wait and watch,if not already in,whether a gap down tomorrow will start off with price back within that triangle,then all this work by RPL has come undone........Else,looking good.
Saint
Charts show that NIFTY is currently waiting for a trend to start whether a downward or upward. But whatever it is, my observation is:
If Nifty starts an upward trend: There are many resistances on the upside and the biggest of all is 200 EMA (daily) which is at around 5000 and if it touches 5000 and falls back a H&S pattern will be formed in Nifty which will create CHAOS in the market.
If Nifty starts a downward trend: On the lower side there is a crucial support at 4500 and below that Nifty has no support before 4100. I consider the 4468 level as hypothetical. Nifty has already tested that level once and this time it wont.
My chart study says that it is difficult for Nifty to reach even 5200 in near term.
Regards,
Mukesh Udasi
Disclaimer : My postings are only to make the fellow members think from different points of view, use their abilities, and decide what they think is proper to do with their own money.
Attachments
-
 30.1 KB Views: 55
Last edited:
D
Thanx Ashishda , Karthik, Renu n all ...
I just posted what i got ,.. Still hoping any good code master for MS will make this job more better.
Thanx KKseal ,.. will look forward to ur suggestion... will try to improve it...
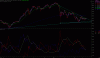
I tried to apply it on other charts ,... and to my surprise ,.. it a great handy tool for finding divergences...
Then too it depends on person to person ... which indicator works for them better.
Regards,..
Darsh
I just posted what i got ,.. Still hoping any good code master for MS will make this job more better.
Thanx KKseal ,.. will look forward to ur suggestion... will try to improve it...
I tried to apply it on other charts ,... and to my surprise ,.. it a great handy tool for finding divergences...
Then too it depends on person to person ... which indicator works for them better.
Regards,..
Darsh