Options - Price and premiums

lemondew

Well-Known Member
#11
I didnot quite understand the dates for which you have put the data. It would be good if you can elaborate. That brings me to the next point which I am posting next.

First column shows the underlying price.Other columns shows the premium of call and put options combined for the strike price mentioned in the top.


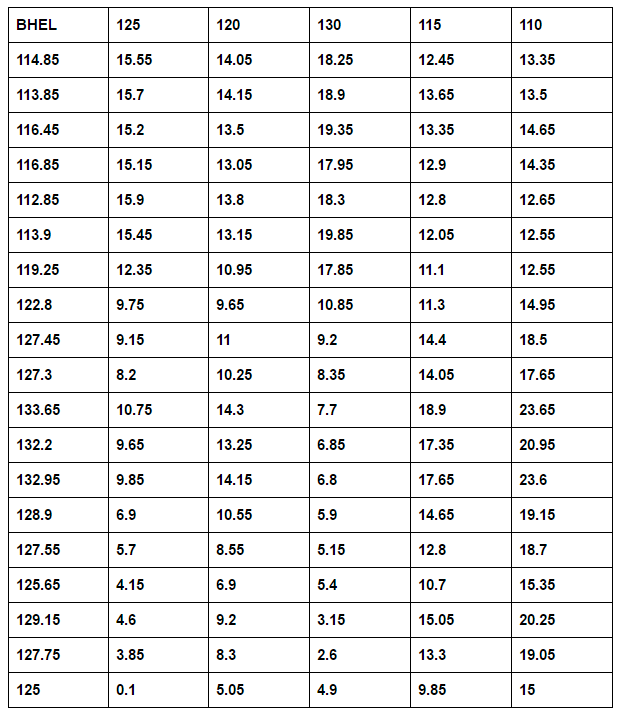
For 125 strike price, the combined premium went from 15.55 to 0.1.

For strike price 120, 125 and 130, combined premium = 47.85
and at expiry premium = 10.05.
 

lemondew

Well-Known Member
#12
There is Unfortunately no broker who gives you data which shows whether options are fairly priced, cheap or costly.

The excel below I have made myself for knowing which among the stocks have the highest premiums.


This excel sheet lists the stocks in order of most expensive premiums to least expensive premiums. 31st may has not been a day where premiums have been high for any of these stocks.

But if you necessarily have to take a position you know which one gives how much premium. Which is costly and which is comparatively cheaper. OTM ITMs are relative to ATM. If ATM is expensive the others as well are expensive...

Note : This was run at 11:50 time afternoon during market hours.
 
Last edited:

lemondew

Well-Known Member
#13
straddle at infy on 31 may was worth 60 or 4.83% of its future price.

A day before its last results it 1180 straddle was worth 93.55. The result was anounced on friday morning which was holiday and stock can react only on monday 3 days of premium loss again

On monday it went to 1250 before coming back and closing on that expiry was at 1208. Short strategies like iron condor gives good money deep OTM as well on such days where premium are high.

NOTE: premiums of 93 when it generally is around 60-65 doesnt mean stocks would expire 100 points above or below the current price.

But it certainly means a condor deep OTM above and below would still fetch you a good price......

Strategy should be such that a miss if in case you go wrong should still not make a really big loss. And a win should have high probability and fetch a decent sum.
 
Last edited:

vagar11

Well-Known Member
#14


For example consider 31st may 2016 for this june series. Consider premiums for ATM options strike
As per this image On 31-5-2016 at 11:50 SBI futures were trading at 195.85. The premium of SBIN 195 calls =9.1 (column F) puts = 8.35(column g) Combined premium of straddle (column I) 17.45. This is 8.9% of its futures price (column J).

The combined premium of Nifty at same time was 270.6 or 3.30% of its futures price.


The image also shows the stocks in order from higher premium to lower. Here BHEL had highest premium percentage while Wipro had lowest premium percentage in stocks.Nifty had lowest. Also keep in mind some stocks tend to have higher premium while others dont. Nifty always have lower premiums compared to volatile stocks like tatasteel.
Do you have any excel sheet that will update its prices live? I mean it's difficult to scan so many stocks and then look for the premium.

So, we can initiate a trade when Straddle premium % is high. Can you tell after how much % move in underlying we will be in loss.

This short straddle gains most when you execute it for the strike price where the stock is going to end up at month. Do you have any criteria for selecting strike price ?
 
#15
Won't it be much better comparison to have cost of straddle with NRML margin (or Span) rather with total margin? In that way we can have a idea how much cost we are at compared to cost of futures?
In my view if you get SBIN IV at around 30% it's good for buy. For reliance it is 20-25%. It is generally very hard to get TATASTEEL below 40%...
 

lemondew

Well-Known Member
#17
Good for you.

For me the fills are not needed often. I do positional. Once I put a position I exit at a profit or loss after a week to 2 weeks. I also run it all the way till expiry. I dont do intraday in these stocks. I dont restrict myself to nifty now because Nifty doesnt always give me high premiums for selling or I dont get cheap premiums if I am anticipating movements. So that used to restrict my trades in a month. I dont get into a trade until I spot a decent opportunity. A list of stocks gives me more opportunities.

Between 10:00 to 12:30 provides best fill when there is no movement in stocks. At that time the bid - ask price is quite tight in the above mentioned stocks. Then I wait till I get a good deal to get out.

From the list above now I dont easily get into BOB or BHEL. The only reason the stocks fallen and strike price interval is too large. 5 for BOB. If I sell/buy OTM spread the interval is too large.

Eg if I get 1.5 Rs for a OTM condor for BOB. I loose 3.5 RS if I go wrong as the min distance between 2 strikes is 5 which is too large for a 130 Rs stock. BOB is good if it is at 180 and above


Lemondew,

Used to trade stock options with 'high liquidity' till I found trading index options is the best. More liquid, more safe, and still providing better fills and opportunities.... No matter how liquid a stock is, still the depth of liquidity cannot match the index..... And before/during results, stock options are better avoided in my view....
 

lemondew

Well-Known Member
#18
I have written 3 scripts which does all the needed and sorting. It will do it real time. May be I ll just share screen for today when I run it.

I cannot scan so many stocks futures and strike prices and option prices continuously as NOw gets disconnected. And it locks my account. I ve to call up and free it. So i run these scripts 2 times a day of i am looking to get in positions.

I dont get into straddle as I dont like unlimited risk.... I prefer debit credit spreads, iron condors. long condors as risk is clearly defined. I dont want to get into strategies in this thread.

The main i want to convey is by knowing the price of options in comparison to how it generally is priced it is easier to run strategies. One should know how the premiums are compared to other stocks to get the best one. One should also know if the premiums are high or low compared to premiums of the same stock last expiry or year before.

Please be aware of if the options are expensive or cheap before getting into any strategy.....

In US there is something called IV percentile. If Iv percentile is 95 it means 95% of time the prices were lower than what it is now. This is good for shorting. This is what I am trying to convey.

http://blog.optionsamurai.com/implied-volatility-percentile-iv-percentile/


Do you have any excel sheet that will update its prices live? I mean it's difficult to scan so many stocks and then look for the premium.

So, we can initiate a trade when Straddle premium % is high. Can you tell after how much % move in underlying we will be in loss.

This short straddle gains most when you execute it for the strike price where the stock is going to end up at month. Do you have any criteria for selecting strike price ?
 

lemondew

Well-Known Member
#20
I think I have not explained clearly the purpose is to compare todays straddle with yesterdays, last months and average price of straddle. Today straddle price is 5% of future price. Last month it was 7% of future price. Hence straddle is cheaper. We have VIX for nifty but nothing for stocks. Hence I ve done this jugad........


I dont mind posting the screenshot for every 1-2 days for straddle price % of future price. In that way we know straddle is cheap or expensive compared to last few months and compared to other stocks ....

Again then generally high price short strategy/ low price long strategy. you use the data the way you want..... run the strategies you want up to you

Won't it be much better comparison to have cost of straddle with NRML margin (or Span) rather with total margin? In that way we can have a idea how much cost we are at compared to cost of futures?
In my view if you get SBIN IV at around 30% it's good for buy. For reliance it is 20-25%. It is generally very hard to get TATASTEEL below 40%...
 

Similar threads