My trade setups

#41
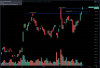
Today I am going to share my analysis for GLENMARK-

1. Long-term had a good rally and it looked like it was about to break a 6 months long range.
1707976772611.png


2. On intermediate-term, this was retesting a swing point. Although, it barely started testing the swing point and had a long way to go*, there was good support nearby to make the price bounce back without going for deeper retrace.
(*side note: Generally after the breakout, when price returns for a test within 6 bars, it can go till the bottom 1/3rd of the test candle before it regenerates)
1707977176409.png


3. On short-term, this tried breaking out of the range with heavy volume but failed. If failure is happening with higher volume then it indicates that price might go back at it once again to test the highs.
1707977357442.png


>> After the test failure, price went near the lower limit of the short-term range which had a decent support. It was a good place to take a position. I bought it @873. I kept the target at around 1001 based on Fib projections.

>> Since I was making this trade on short-term, I kept my stop below the short-term range at around 839.

>>The price went for the short term bounce after the test but started drawing down with the correcting market. This trade didn't go as expected and it hit my stop. I have already closed this position last Friday @835.

>> Please note that on a little longer term this is still bullish and doing a deeper retrace as expected. I just didn't want to go along with it for the test and take further loss here for now.

>> As of today, this is at the bottom of the retest zone where it looks like a decent buy. I will wait to see if it has good strength and if the overall market also supports this, I'll buy another position in this.
 
#42
Next stock in my portfolio is DEEPAKNTR. Here is my analysis for this-

1. On long-term, this is going through a big 2 years long range. The good part about the range is that it is quite narrow which gives enough support for a short-term opportunity. So if I am too optimistic, it will try to break the swing points of the range and have a nice rally. If I am pessimistic, it will give small drawdown and will hold near the bottom of the range for a while.
As you can see below in the chart, this has already broken out the 2 swing points and currently doing a retest on it.
1708058170251.png


2. When I go to the intermediate time-frame, the story is even better. It is already testing an important swing point here. The good part about it is the price is near the bottom of the swing point which is also supported by multiple high vol bars. So the chances of failing the test and penetrating below reduces quite a lot here.
The swing point test is also quite ideal, that is, the breakout happened on a big vol and the price was coming back for test with very low vol.
1708058523988.png


>> I took a position in this on 29th Jan @2236.40. Since that day the price is being held there itself and hasn't shown any big move. In the last 2 days the price is finally trying to move up. Hopefully it would regenerate from the test area in the coming week.

>> I kept a partial stop @2140. At this price the test would already be failed and the price would have penetrated through the important support bars. But this would also be not enough to shown that the trend has changed to bearish. If it drops below 1900 area then I can say it to be bearish and that's where I'll have my hard stop.

>> As of now I couldn't decide the target as the bullish momentum was not yet there. Once the price regenerates and shows some strength then I will decide target here. But for now, I have kept the target as back to the highs as it should at least go till that point.

I will put out an update post on this once I make any move here.
 
#43
Today I am going to talk about ITC. ITC was there in my watchlist since December last year. This turned pretty strong in the last couple of years and it looked like this would be going strong further. I was anticipating for a decent retrace to get an entry in this.
This trade didn't turn out to be a winner, but anyhow, I will share the thesis I had for this stock. I will also talk about how and why I closed this position.

My analysis-
1. On long-term, this was looking pretty strong for the last 2 years. In the last 6 months it was consolidating and looked like it will go for another rally post breakout of this range.
1708324840275.png


2. On intermediate-term, post making all time high, it retraced back and consolidated for a good time (the 6 months range discussed above). This created a good support and It finally broke-out in late December. it did a successful retest-regenerate but came back again for another test into the bottom of the range. When price comes back for the 2nd test, the probability of it regenerating again drops quite a lot and it is as good as a coin toss. Even after this, it still looked interesting to me mainly because of good support just underneath the price and overall strong market conditions.
1708325238576.png


Setup-
1. I took a position in this on 29th Jan when it was trading @455. I could have waited a little and made an entry on smaller time frame but I didn't want to miss this out seeing how the markets were going at that time.

2. I was hoping that it would not penetrate the support area. If it does, it might go a little further down to test and break the swing point low near 425 mark. If it breaks that then I would close my entire position there.

3. I kept a target near 495 going back to the highs. Once it would have traveled till that mile, I would have decided to sell or keep it further basis on how strong it is.

Closing the position-
As you can see in the current charts, this did not go as I planned it. This was making strong downside moves and I was prepared to close it whenever it shows the first sign of strength. Unfortunately, that never happened and I kept a hard stop @ 425.30 which got hit on 8th Feb.

To be clear, this still looks good on long-term. As I was not holding it for longer term, this was not going well for me. I will keep an eye on this and wait for the price to go further down (maybe near 370). If I get a good setup there I would definitely try to take another shot at this.
 
#44
Next stock in my portfolio is JKLAKSHMI. Here is my thesis for this-

This stock was breaking out on all time frames. Monthly, weekly and daily all had breakouts happening simultaneously. When such conditions exist, there is a really high probability (around 82%) for a new rally to begin from there.

Monthly-
1708412833589.png


Weekly-
1708412853641.png


Daily-
1708412877759.png


I bought the position immediately on the breakout as sometimes such setups doesn't give a chance for a retest. I kept my target at 1230 as multiple Fibonacci projections were aligning in that area. I kept the stop at 819.40 as this would fail the swing points already and also penetrate below the daily range.

As of now, this is trading a couple of %age points above the breakout point but looks pretty strong. Once it makes a good spike upwards I'll raise the stop a little bit. I'll make an update post on this once I make any move here.
 
#45
The next stock in my portfolio is ICICIBANK. Here is my analysis for this-

1. This stock is quite strong on long term. (Note- I always look for cases of bullish long term because that increases the probability that a retrace on short term is in fact a retrace only and not a trend changing move. It's always good to sail along the wind.)
View attachment 50232

2. On intermediate term, the price was going for a retrace, retesting two important swing point highs. The breakout of these swing points happened on a higher volume whereas the retest was happening on relatively lower volume. This increases the chances of regeneration.
View attachment 50233

3. The short term action was also very supportive, given this had a big breakout earlier, breaking out four swing points. In case it comes for a deeper retrace to this area, there were very high chances that the price will push back up.
View attachment 50234

>> I bought this when the price was around 1000. I bought it here since it was around a good support area (formed by the consecutive high volume bars). I didn't wait for the price to go for a retrace to the swing point area because in majority of cases when multiple swing points are broken, it is not necessary that the price will go for a retrace. It can just simply go up. But in case it comes into this swing point area for a test, I would maybe buy some more quantity there.

>> I have kept the stop below the bottom of these swing point candles, because if the price penetrates below this then definitely it won't be a normal retrace and the short term trend might be changing to bearish or sideways at best.

>> I have kept the target for around 1100 for now based on the Fibonacci projections, but it is not really absolute. I will see how the price behaves post the regeneration and on the basis of that I would adjust my target accordingly.

So far the price is still lingering around my entry area. I will write an update post once I make any move on this.
Update on this position-

ICICIBANK is now breaking multiple swing point on daily time frame. I am expecting it to go above my initially mentioned target of 1100.
I am also raising my stop to 1017.40. Price going below this will nullify all the steam of the breakout.

1708489808481.png
 

Attachments

#46
I have been taking a lot of positions these days. It is getting very tough to update about it real-time. I am trying to post one position a day. Hopefully, in a week or so I will successfully update about all the stocks in my portfolio and then will continue making real-time updates.

For today, I am going to share my analysis on BAJAJHLDNG. I bought this during late-January and have held this as of now. Below is my thesis for this-

1. On long-term, this has been very strong ever since covid drop. It tested an important swing point mid last year and has continued its trend*. This gives confidence that the long-term bullishness is not exhausted and will be there for a while.
(*side note: I prefer stocks which keep on testing there important support points and then regenerate from there, as compared to the ones who are just straight shooting up. The former indicates solid belief in the trend whereas the latter feels more like a bubble which can do a 10-20% correction on any single bad day)
View attachment 50395

2. On short-term, this broke-out 3 big swing points and went for a quick retest the next day. This was a good opportunity to take a position here. Generally, when multiple swing points are broken, it is highly probable that the retest will easily regenerate from there. Also, the overall condition of breakout was very promising as the break was happening on big vol and the test was happening on comparatively very low vol.
View attachment 50396

>> I entered this position @8390. I kept a stop around @7600 because if the price goes till there then all the swing points would have failed by then and it would be penetrating below the daily range. If that happens then it wouldn't be a normal retest and the short-term trend would be shifting to either bearish or sideways at best.

>> I kept a target of 8850 based on the Fibonacci projections but I'll shift this up once I see good momentum in this stock.

>> As of now, the price has successfully regenerated and slowly building upwards. I'll be making a follow-up post once I make any move here.
Update on this position-

Today this has reached our initially mentioned target of 8850 (mentioned in the reference post). Although this still looks pretty strong to me, I have closed just 20% of my position to reduce risk here. Closed the 20% @8864.
Also raising the stop to 8588.60 for the remaining 80% of the position.
 
#47
Today I am going to share my analysis for MARUTI-

1. On long-term, this was pretty strong. On top of that it was also doing a retest on one of the swing points.
1708583839375.png


2. The intermediate term also reciprocated the long-term story. The retest was happening here as well with an added advantage of it happening after around 20 bars. Such retest always have way better probability of regenerating. There was also good support around it by high volume and wide price bars.
1708584098485.png


3. The short-term gave a good opportunity to enter when the stock was failing multiple break-downs of an important swing point low. Failing with lower volume is a good indication that it might get reversed anytime.
1708584227788.png


>> I took a position in this on 30th Jan. Luckily for me, it started reversing from the next day itself and regenerated with good strength.
>> I kept a stop below the weekly swing point high bar. Since it started regenerating quickly, I systematically raised my stops to secure some profits.
>> There were multiple Fibonacci projections active on this (which also indicates higher chances of rally). Based on them I kept an initial target of 10630.

>> This reached my target on 5th Feb but started reversing from there. Just to be safe, I sold out 25% of my position there @10600. By next day it continued its rally. I sold another 50% on 8th Feb @10765.40. The price quickly recovered from there next day itself and have been having a strong rally ever since. As of now I am holding just 25% of my initial position. It has already crossed its expected projection and might be loosing its steam soon. I will close this position with the first sign of a pullback on this.
 
#48
JINDALSTEL is another stock in my portfolio. This was my anaysis-

1. Long-term looked pretty strong. It did the healthy rally-consolidation-rally kind of flow.
1708664142591.png


2. On intermediate and short term, this was breaking out. Breakout of a swing point on weekly and 3 swing points on daily charts. Generally if a stock is breaking out multiple swing points on multiple time frames, there is really high probability (around 82%) for the next rally to set in.
Weekly-
1708664387057.png


Daily-
1708664412035.png


Based on Fib projections, I am expecting this to go till at least 830. I have kept my stop at 711.90 as by that time it will fail all the swing points and anchoring support zones.
 
#49
The next stock in my portfolio is SONACOMS. Here is my analysis-

1. Auto sector in general was pretty strong. It was testing its strong support area in mid-January. It looked ike it would easily regenerate from there. I was looking for an auto stock which would bounce up because of this regeneration. SONACOMS looked promising here as it was also testing important swing point and the price was strongly held with good support.
View attachment 50384

2. The short-term story was also pretty good. It broke-out two swing points with great volume and came for a test later (after 10 bars) with very less volume. it was a high probability bounce scenario.
View attachment 50385

>> I bought this near 580 with an initial target of around 648 (going back to the highs). I kept my stop at around 529 because if the price goes till there then all the swing point tests would have failed and my hypothesis would have been proved wrong.

>> The price regenerated as expected. It came very near my target zone but started reversing with the overall market correction. Although there was nothing wrong with some correction, I wanted to reduce my risk here. I closed 30% of my position @616.35.

>> I still have 70% of the remaining position in my portfolio. I will try to book some more profit once it bounces near 640 area. I will update once I make any move in this position.
Update on this position-

As I mentioned in the reference post, I wanted to book some profit once the price reaches 640 mark. Today this stock got a good spike and gave an opportunity to book some profits.
I had already closed 30% of my position earlier (mentioned in the reference post). Today I closed 20% @640 and another 20% @650.
I will keep the remaining 30% for now to see if I can capture some more dough here based on its momentum. Otherwise, I'll close it out once it shows some kind of a drawdown.
 
#50
The next stock in my portfolio- JSWSTEEL. Here is my analysis:

1. On long term, this stock was in a range for last 3 years. it broke-out from this range in July last year, cam for a quick retest and regenerated post that in December. Considering that this breakout is not false, it should have a good leg-up after this long consolidation.
View attachment 50308

2. On intermediate level, the price was doing a retest on one of the swing point highs. Please note that this was the second test for this swing point, so the chances of regeneration drops in such cases. But apart from this, the test was happening at a strong support zone which reduces the chances of failure.
View attachment 50309

3. On short-term, the price also showed critical support which made the entry easier. I entered in this trade at around 830.
View attachment 50310

>> As of now, I am targeting the highs at 883. I will decide if I should hold further, exit partially or exit completely based on the strength/weakness the buyers shows at these highs.
>> Although I am expecting the price to hold at this support at 810, I will exit this position only when it shows weakness on weekly chart and fail the swing point test there.

I took ths position on 15th Jan. On 18th Jan, the price slipped and broke the daily support level which decreased my conviction in this trade. I had then cut my position in half just to be comfortable in dealing with less probability (sold 50% @ 805.65). Currently I am holding the remaining 50% and expecting this to show a regeneration in the upcoming week. I will be updating here in case I make any further move on this position.
Update on this position-

This was not going as expected and just lurking around in the daily range. I had already closed 50% earlier (mentioned in the reference post). I closed the remaining 50% position today @ 807.
 

Similar threads