Experiments in Technical Analysis

casoni

Well-Known Member
#71
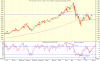
hello , this metastock indicator gives hindsights, dont take buy-sell decision based on this indicator, as it changes it signals....this indicator is good for indentifying high&lows......thanks ....
jaykiru said:
Ok Karthi
I m first
I Found Two indicator For meta stock


1)Elliot Wave :
------
pr:=Input("Elliot Wave minimum % move",
.001,100,2);

{ Beginner Elliot Wave stuff }
EWpk:=PeakBars(1,H,pr)=0;
EWtr:=TroughBars(1,L,pr)=0;

{ Intermediate Elliot Wave stuff }
zz:=Zig(C,pr,%);
zzHi:=Zig(H,pr,%);
zzLo:=Zig(L,pr,%);
avg:=(zzHi+zzLo)/2;

{ Advanced Elliot Wave stuff }
RetroSuccessSecret:=If(EWpk,zzHi,
If(EWtr,zzLo,If(avg>Ref(avg,-1),H,L)));
EW:=Zig(RetroSuccessSecret,pr,%);

{ Plot on price chart }
EW
--------------------------
2)Elliot Wave Signals :
--------
pr:=Input("Elliot Wave minimum % move",
.001,100,2);

{ Elliot Wave engine }
EWpk:=PeakBars(1,H,pr)=0;
EWtr:=TroughBars(1,L,pr)=0;

zz:=Zig(C,pr,%);
zzHi:=Zig(H,pr,%);
zzLo:=Zig(L,pr,%);
avg:=(zzHi+zzLo)/2;

RetroSuccessSecret:=If(EWpk,zzHi,
If(EWtr,zzLo,If(avg>Ref(avg,-1),H,L)));
EW:=Zig(RetroSuccessSecret,pr,%);

{ Buy/Sell Elliot Wave stuff }
EWbuy:=TroughBars(1,EW,pr)=0;
EWsell:=PeakBars(1,EW,pr)=0;

{ Plot on own window }
EWbuy-EWsell
____________________________________
Kaisa laga . please tell me .
 

karthikmarar

Well-Known Member
#73
AJAY said:
Friends,

Say, take a 13 period EMA on the price chart and draw one more 13 period EMA to the earlier drawn 13-EMA which is drawn on the price chart. It means it is now you have 2 EMA's on the chart. One is for the Price and the other one is for that MA. It is nothing but 13 EMA for 13 EMA. Hope it is clear. Now draw RSI(14) to this 13 EMA which is drawn later. Look at RSI(14). How strangely it behaves. You will find RSI(14) reaching levels to 99.99 on tops and <1 on bottoms. Now start observing the trens on price chart. Observe how it behaves. You youeself can understand how to infer the move.

Thanks and Happy Practicing TA

AJAY
With Ajays permission I am bringing here a very interesting study posted in his excellent thread. A very good Indicator for long term. Let us look at what we are trying to do exactly here. If you look at the formula for RSI it is based on the ratio average up moves to the average down moves in the given period. When the trend is up the averages up moves are more and the RSI is moving up and vice versa. Here we are removing the noise by smoothing the price curve. We are further smoothing this value thereby removing most of the noise. So when the trend is up the line quickly moves up into to the overbought region and stays there when the trend is still up. The same is the case for down trend.

The question which interested me was whither the same idea can be used by short and medium term traders. As a first step we will not double smooth it. Let some noise remain as we are dealing with shorter term. So let us plot a RSI(14) of a 13 day EMA and see how it works. You can see for yourself in the attached chart. It helps to catch the medium term trends nicely. Enter when the indicator crosses above 80 and sell when it crosses below. I am sure which little manipulation of the parameters the swing traders too can use this idea effectively.

For easy reference I am posting Ajays chart also here.

Happy Experimenting

Regards

Karthik
 
Last edited:
#74
karthikmarar said:
So let us plot a RSI(14) of a 13 day EMA and see how it works. You can see for yourself in the attached chart. It helps to catch the medium term trends nicely. Enter when the indicator crosses above 80 and sell when it crosses below. I am sure which little manipulation of the parameters the swing traders too can use this idea effectively.

For easy reference I am posting Ajays chart also here.

Happy Experimenting

Regards

Karthik
There is a Martin Pring Short Term Filtering System which is reverse of the above. It calculates MA(8) of the RSI(9) and gives trading signals when the MA moves down and crosses below 70 or it moves up crossing 30. For reference, NIFTY chart is enclosed.

During the course of my study I have found that best signals are given when both RSI and MA move down/up in the overbought/oversold territory and MA crosses RSI.

Of course, for exit we need to use another system.

As you said, happy experimenting.

Best Regards,
--Ashish
 

Attachments

karthikmarar

Well-Known Member
#75
Hi

For the Amibroker fans who want to play around with the RSI of MA stuff, here is the afl of the combo indicator MARSI.

Happy Experimenting

regards

Karthik
 
Last edited:
#76
karthikmarar said:
.... So when the trend is up the line quickly moves up into to the overbought region and stays there when the trend is still up. The same is the case for down trend.
.....................
It helps to catch the medium term trends nicely. Enter when the indicator crosses above 80 and sell when it crosses below. I am sure which little manipulation of the parameters the swing traders too can use this idea effectively.
Dear Karthik,

Colorful bollinger bands looks great, waiting for the afl for that :D

MA-RSI, it serves the purpose of identifying medium-long term trend, but i couldnt identify the entry. Can you please elaborate on this?

ashish said:
There is a Martin Pring Short Term Filtering System which is reverse of the above. It calculates MA(8) of the RSI(9) and gives trading signals when the MA moves down and crosses below 70 or it moves up crossing 30. For reference, NIFTY chart is enclosed.

During the course of my study I have found that best signals are given when both RSI and MA move down/up in the overbought/oversold territory and MA crosses RSI.

Of course, for exit we need to use another system
Thanks to ashish, for the ongoing discussion on this topic, looking for more explanatory comments..

Thanks & Regards
Siva
TA Beginner
 

karthikmarar

Well-Known Member
#77
Hi Siva

I am enclosing the afl for th colored BB. :) Just replace the BB section in the price chart with this. You can experiment with different colors.

Regarding the MA-RSI I would like to stufy further and will post possible entry conditions.

regards

Karthik
 
#78
karthikmarar said:
For the Amibroker fans who want to play around with the RSI of MA stuff, here is the afl of the combo indicator MARSI.

Karthik
Hi karthik,

Some are here metastock fan. So please Metastock Code also share with us.

Thanks & regards,

(moneypick)
 
#80
Hello I'm new to the forum, has anyone else received the below link to a technical analysis website based on the Nifty Index?

http://213.107.199.218/india.htm

your thoughts would be very welcome
Best regards:
 

Similar threads