Amibroker - AFL Examples

#81
I someone well versed with writing afl add arrow at buy and sell signals
Its actually simple. Please refer to some sample AFL's and see how the Buy and Sell variables are used. Try it..its very simple.

and who i can use it for scaning . I mean wht filter settings I need to do to get this is done
I've already told you about them. Read my replies again.
 

chintan786

Well-Known Member
#82
Its actually simple. Please refer to some sample AFL's and see how the Buy and Sell variables are used. Try it..its very simple.


I've already told you about them. Read my replies again.

good evening sir, here is the formula

function T3(price,periods) //AMA-based
{
s = 0.84;
periods = 2/(periods+1);
e1=AMA(price,periods);
e2=AMA(e1,Periods);
e3=AMA(e2,Periods);
e4=AMA(e3,Periods);
e5=AMA(e4,Periods);
e6=AMA(e5,Periods);
c1=-s*s*s;
c2=3*s*s+3*s*s*s;
c3=-6*s*s-3*s-3*s*s*s;
c4=1+3*s+s*s*s+3*s*s;
Ti3=c1*e6+c2*e5+c3*e4+c4*e3;
return ti3;
}
Plot(C,"",4,64);
Plot(T3(C,50),"T3",colorYellow,1);
Plot(t3(C,20),"T3",colorBlue,1);

for buy-sell signal the formula is


shape = Buy * shapeUpArrow + Sell * shapeDownArrow;
PlotShapes( shape, IIf( Buy, colorGreen, colorRed ),0, IIf( Buy, Low, High ) );

GraphXSpace = 5;
dist = 1.5*ATR(10);

for( i = 0; i < BarCount; i++ )
{
if( Buy ) PlotText( "Buy\n@" + C[ i ], i, L[ i ]-dist, colorGreen );
if( Sell ) PlotText( "Sell\n@" + C[ i ], i, H[ i ]+dist, colorRed);
}

now plz sir

can u plz tell me where to put this in above first formula

and as far as scaning is concerned it is not possible with first one

thanx
 

chintan786

Well-Known Member
#83
Its actually simple. Please refer to some sample AFL's and see how the Buy and Sell variables are used. Try it..its very simple.


I've already told you about them. Read my replies again.
hi bvpraveen sir, i finally made it.

I sucessfully merge the advantage of 2 afls into one and yes now I can do scaning also.

thanx for showing me right path

cheers

LONG LIVE TECHANICAL ANALYSIS
 

chintan786

Well-Known Member
#85
sir , have u tested the above AFL. it is tillson's T3.

i find it good but yet to apply in real life.

wht abt

bye
 
#86
Chintan,

I'm not trying any mechanical system. Hence I don't know much about indicators and their performance.

May be others can help you out.

Praveen.
 
#87
On going through the various posts and replies, it is understood the bare need of most the members on the AFL and finding a right AFL which could give them a Buy/Sell signal.

Let me request the Moderators to create a Link and post the AFLs alone with short notes to download. This could help all our new members as well as for every one to enhance the AFLs.

Regrds
SunilMogan
 
#88
Guys,
I noticed that a breakout in price with volume surge after a long period of very low volatility usually indicates significant uptrend.

Please take a look at the chart of EDAC:
http://clearstation.etrade.com/cgi-bin/details?Symbol=EDAC

I use the following AFL code to detect daily wide range bars and volume surges:
VolAvg = MA( V, 14 );
VolumeIdx = V / VolAvg;
Buy = Close > 1.04*Ref( Close , -1 ) AND Close > 1 AND VolumeIdx > 1.5;

My question: how do you filter the result to only find those with extremely low volatility before the Breakout?
Thanks very much
Brian
 
#89
Saji and SGM,
Firt a heart felt thanks to you guys to make us understand something out of AFL . Iam pretty new to Ami and learning AFL. So right now you may call me a novice.

I had downloaded the Ichimokku AFL and trying to analyse how it performs and so on. You guys had already beaten this indicator to death i beleive.

Pls have a look on the following zip file. i had attached SRF where i had included this AFL and trying to get signals from it.

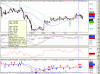
First, i beleive that one should make money in long and short. But this indicator is primarily plotting a long entry and exit signal. If you can see the exit signals of this indicator, there is a better probable short signal arising when it is plotting a exit signal. If you can see most of the exit signals, it is primarily showing us a short entry signal for the next two trading sessions. This can be used for entering into shorts.

If someone can tweak the indicator to generate short signals, we can backtest it and see how it performs.

Iam just putting you forth with my analysis. Pls review it and let me know whether iam on track.

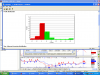
Also that if you can see the SRF trade chart, i had put in a range from 1/1/2006 - till date and had generated the report. In this chart, we can see that lots of trades happening around -5ve. I would beleive that the Formula is telling us to exit out within least losses( which is good). But the number of trades happening out of this is higher. Should we have to tweak a little more on this.

Again, just putting you forth with what i think. am still learning....

regards..:)
 

Attachments

#90
Hello saji sir,

Thank you for your post.I am new subscriber to amibroker.The post is usefull for me.But i am not able to see the zip file plesase help.
 

Similar threads