


Thoughts on Day/Swing Trading
- Thread starter Smart_trade
- Start date
- Status
- Not open for further replies.
ST, I have recently read in Capricorn's thread something like, if the tops in the Double-Top fomation are 6 months or so apart, it is invalid. But I find them in many scrips' weekly/monthly charts having a predictble effect on subsequent patterns.
If it is not much of a bother, please shed some light on it whenever the time permits you. Thanks.
If it is not much of a bother, please shed some light on it whenever the time permits you. Thanks.
So if the second top is within a period of 6 months, market fundamentals are unlikely to have changed drastically and there are better chanced of the double top working because of selling by trapped bulls. But I have seen the significant tops like 2008 top are always fresh in the minds of market participants and if in future our market approaches that point , there will be many trapped investors wanting to get out of their worthless investments made in 2008 so that point will attract lots of selling. But some minor top in 2009 or 2010 no one remembers ....so those minor tops are not likely to be inducing selling if we approach them again.
So in my view double tops made with minor tops with the first top beyond 6-8 months ago are not likely to succeed but with major tops they will work even if they are spaced some years apart.
Smart_trade
Dear ST,
I thought that providing links to external sites is prohibited in this forum. If you
think it's ok, I can post the link here itself!
I thought that providing links to external sites is prohibited in this forum. If you
think it's ok, I can post the link here itself!
In any case interested persons will contact you by PMs.....
ST
....N(Z) = 1 - N'(Z) * ((1.330274429 * Y ^ 5) - (1.821255978 * Y ^ 4)
+ (1.781477937 * Y ^ 3) - (.356563782 * Y ^ 2)
+ (.31938153 * Y))
= 1-.05399093525* ((1.330274429*.68339443311 ^ 5)
- (1.821255978 * .68339443311 ^ 4 + 1.781477937
-.68339443311 ^ 3) - (.356563782 * .68339443311 ^ 2)
+ (.31938153 * .68339443311))
= 1 - .05399093525 * ((1.330274429 * .1490587)
- (1.821255978 * .2181151 + (1.781477937 * .3191643)
- (.356563782 * .467028 + .31938153 * .68339443311))
= 1 - .05399093525 * (.198288977 - .3972434298
+ .5685841587 - .16652527 + .2182635596)
= 1 - .05399093525 * .4213679955
= 1 - .02275005216
= .977249947
Taken from Ralph Vince's book, the above is a part of the equation to figure out Normal Probability Density of an event to occur in a random process, with a failure rate not exceeding 2%. So, guys, anyone still want to have this book, make sure you also request Murthy for books on Probability!
(Actually, the above equation is not that difficult as it looks. I guess ST must be joking when he said he couldn't go past the first 50 pages.)")
Take care, guys.
+ (1.781477937 * Y ^ 3) - (.356563782 * Y ^ 2)
+ (.31938153 * Y))
= 1-.05399093525* ((1.330274429*.68339443311 ^ 5)
- (1.821255978 * .68339443311 ^ 4 + 1.781477937
-.68339443311 ^ 3) - (.356563782 * .68339443311 ^ 2)
+ (.31938153 * .68339443311))
= 1 - .05399093525 * ((1.330274429 * .1490587)
- (1.821255978 * .2181151 + (1.781477937 * .3191643)
- (.356563782 * .467028 + .31938153 * .68339443311))
= 1 - .05399093525 * (.198288977 - .3972434298
+ .5685841587 - .16652527 + .2182635596)
= 1 - .05399093525 * .4213679955
= 1 - .02275005216
= .977249947
Taken from Ralph Vince's book, the above is a part of the equation to figure out Normal Probability Density of an event to occur in a random process, with a failure rate not exceeding 2%. So, guys, anyone still want to have this book, make sure you also request Murthy for books on Probability!
(Actually, the above equation is not that difficult as it looks. I guess ST must be joking when he said he couldn't go past the first 50 pages.
Take care, guys.
hi st da ,
hope u r enjoying the festival.
i m enclosing a 30m chart of apollo tyres with tdst resistance line on chart/buy set up complete.as you have named the set up as buy set up, is it alright to take risk and go long, depending on price action in 5m tf.it is little contradictory that on completion of buy set up, we get tdst resistance line. pl put some light on this also.
regards,
girish
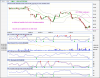
attaching the chart. exceeded the limit.on chart read negative divergence on daily and weekly charts.
regards
girish
Attachments
-
 51.2 KB Views: 435
Last edited:
So, guys, anyone still want to have this book, make sure you also request Murthy for books on Probability!
I find it a lot easier to hand over the link, than understanding the book.
I couldn't get past the initial few pages!
I would rather wait for ST-mark explanations, which are to-the-point and
understandable to dummies like me!! I would never have understood a
concept like TDST or Sequential, if it were not ST who introduced the
whole thing in simpler terms!
I know, Murthy, where you're coming from. Yes, ST has that gift to simplify complex things. I mean, I personally rarely have problems getting to the core of any complexity (that itself is a gift!). But still I look forward to ST's explanations of them. I feel like I am reading my own thoughts!
But I would rather that he takes care of his back first than thinking to make Vince chewable for you, Murthy!
Good night
). But still I look forward to ST's explanations of them. I feel like I am reading my own thoughts!But I would rather that he takes care of his back first than thinking to make Vince chewable for you, Murthy!
Good night
I find it a lot easier to hand over the link, than understanding the book.
I couldn't get past the initial few pages!
I would rather wait for ST-mark explanations, which are to-the-point and
understandable to dummies like me!! I would never have understood a
concept like TDST or Sequential, if it were not ST who introduced the
whole thing in simpler terms!
I couldn't get past the initial few pages!
I would rather wait for ST-mark explanations, which are to-the-point and
understandable to dummies like me!! I would never have understood a
concept like TDST or Sequential, if it were not ST who introduced the
whole thing in simpler terms!
hi st da ,
hope u r enjoying the festival.
i m enclosing a 30m chart of apollo tyres with tdst resistance line on chart/buy set up complete.as you have named the set up as buy set up, is it alright to take risk and go long, depending on price action in 5m tf.it is little contradictory that on completion of buy set up, we get tdst resistance line. pl put some light on this also.
regards,
girish
hope u r enjoying the festival.
i m enclosing a 30m chart of apollo tyres with tdst resistance line on chart/buy set up complete.as you have named the set up as buy set up, is it alright to take risk and go long, depending on price action in 5m tf.it is little contradictory that on completion of buy set up, we get tdst resistance line. pl put some light on this also.
regards,
girish
A buy set up means a set up leading to Sequential Buy signal.....it is always a downtrend so on completion of 9 bars of buy setup we get a horrizontal line from true high of the bar having highest high in the entire set up....so on completion of buy set up you get a line which needs to be taken out if the downtrend is to be negated....hence a resistance line....hope now you wont find it contradictory.

A 30 min chart of Apollo Tyres is posted....the scrip is in severe downtrend after having cracked 3 red TDST support lines as shown in the chart.The latest Buy TDST resistance line is at 69.3 ( 11-8-2011 2:00 high...I am referring to cash charts here ).
Having fallen so much is no valid reason to buy the scrip.....one should be trading it from short side from 21-7-2011 . I never recommend catching a falling dagger. So one can think of buying only after the scrip trades above 65.5 comfortably.....till then no buying thoughts to be entertained....
Smart_trade
I feel like I am reading my own thoughts!
Undoubtedly, your language is flawless - but I like the expression part of it
much more.
Now it's time that you lead a pack of novice traders (including a definite me)
with your ideas, rather than spending your time in enjoying others' posts!
It's an affectionate demand from people like me..
It'd be a Freedom Vs Responsibility kinda struggle - I know, but we
would like to hear more from you!!
- Status
- Not open for further replies.
Similar threads
-
Looking for Feedback on a New Stock Market Research Tool – Your Thoughts?
- Started by Cate25
- Replies: 1
-
-
 Thoughts on "The A to Z of trading career - musings of a professional trader !!"
- Started by madank
- Replies: 213
-

-