


TechViews
- Thread starter karthikmarar
- Start date
A long consolidation and on Daily chart one can find a number of patterns. Difficult to say, which one to rely upon. I can see Symmetrical Triangles (Both broken with lower boundary being retested as well as unbroken boundaries - Afterall triangle boundaries are allowed to be redrawn), Possible H&S (BTW, every H&S is a triangle as well), Falling Channel. All at the same time pointing towards uncertainty but nothing concrete as of now.
Sentiment indicators show tired bears & with every passing week, the fighting zones are shifting higher (From 4500 it went to 4600 and now is around 4700).
However, the major downward sloping trendline of sensex was broken day before yesterday and now price is struggling to move in either direction. We have made daily bars with higher high and higher low (yesterday & today) for last two days but both have been inverse bars. Clearly a tough tug-of-war but nothing concrete as of now.
Regards,
--Ashish
Attachments
-
 13.3 KB Views: 103
Last edited:
Hi friends
I am starting this thread to share some technical views on stocks. My plan was to post these on my blog in the forum. Now I realize that the Blogs are one of the most neglected sections of the forum. In order to learn and improve we need feedbacks on our analysis and thoughts from the experts which was not forthcoming from the Blog entries. So I thought of starting a thread, which has more visibility and hence some comments and feedbacks. Of course the idea is not to restrict to my posts only, others too are encouraged to post their own charts and views.
As most of you know my perspective is restricted positional trades since that is what I do.
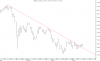
So without much ado let me set the ball rolling. The first chart is a view on the nifty. The Nifty seems to form a falling wedge. Wedges are one of the most difficult patterns to trade. Also there are many different opinions on wedges. In general a falling wedge can be a continuation or a reversal pattern. But a falling wedge after a long up trend is most likely to be Bullish. Also any breakout would have to with a good volume expansion.
Today the nifty retracted from the top wedge line which would around 4780. If my perspective is right and the nifty does not breakout of the wedge soon we may see the nifty slipping down to 4200 levelsthe lower wedge line
My knowledge on patterns is rather rudimentary. It would be nice if other chart experts like Ashish (Aca Trader) add their comments
Regards
Karthik
I am starting this thread to share some technical views on stocks. My plan was to post these on my blog in the forum. Now I realize that the Blogs are one of the most neglected sections of the forum. In order to learn and improve we need feedbacks on our analysis and thoughts from the experts which was not forthcoming from the Blog entries. So I thought of starting a thread, which has more visibility and hence some comments and feedbacks. Of course the idea is not to restrict to my posts only, others too are encouraged to post their own charts and views.
As most of you know my perspective is restricted positional trades since that is what I do.
So without much ado let me set the ball rolling. The first chart is a view on the nifty. The Nifty seems to form a falling wedge. Wedges are one of the most difficult patterns to trade. Also there are many different opinions on wedges. In general a falling wedge can be a continuation or a reversal pattern. But a falling wedge after a long up trend is most likely to be Bullish. Also any breakout would have to with a good volume expansion.
Today the nifty retracted from the top wedge line which would around 4780. If my perspective is right and the nifty does not breakout of the wedge soon we may see the nifty slipping down to 4200 levelsthe lower wedge line
My knowledge on patterns is rather rudimentary. It would be nice if other chart experts like Ashish (Aca Trader) add their comments
Regards
Karthik
Regards,
--Ashish
P.S.:- The experts' comments are still awaited.
Attachments
-
 22 KB Views: 99
Satya
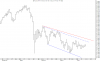
IMHO the low of the 22nd january is an abnormal value (an abnormal panic reaction) and I normally ignore such values. This again is a debatable point.
regards
karthik
IMHO the low of the 22nd january is an abnormal value (an abnormal panic reaction) and I normally ignore such values. This again is a debatable point.
regards
karthik
The difference between abnormal levels and normal levels pointed out.
Best Regards,
--Ashish
Attachments
-
 26.5 KB Views: 100
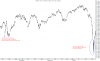
No, Typo, my friend. We have been having a long uptrend for a few years. Attached weekly chart would give a better perspective.
reagrds
Karthik
reagrds
Karthik
Thanks for clarification
Regards
R. S. Iyer
A novice's view of the pattern in the same area. The interpretation and target remain the same but IMHO the third touch is yet due which may come somewhere around 5000 level.
Regards,
--Ashish
Regards,
--Ashish
As told to me by another veteran trader, it is not the pattern perse that is important. It is the events that lead to the formation of the pattern is most important. Many miss this while looking out for a pattern.
Regards,
--Ashish