Some Good Steals...

Status
Not open for further replies.
AMITBE said:
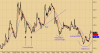
Hi Roneeth...I'm looking at the daily chart for Aksh as early as you.
Yes, the rounded bottom very roughly, culminating in a rather long ranging C&H: The right rim and handle is the action taking place now.

Hello Amit,

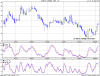
Thanks a lot for replying,yep good action in greaves ....Now i know when to look at Adx, Rsi And MACD....

Regards

Roneeth
 
Hi Amit,

Can you please tell me if TFCILTD has formed a double bottom?. Is it safe to enter now?.

Scrip - Tourism finance corporation of india
Code - TFCILTD.NS

Thanks,
Balaji.
 

AMITBE

Well-Known Member
pnbalaji said:
Hi Amit,

Can you please tell me if TFCILTD has formed a double bottom?. Is it safe to enter now?.

Scrip - Tourism finance corporation of india
Code - TFCILTD.NS

Thanks,
Balaji.
Hi Balaji...what levels are you thinking of...for the double bottom?
Would be interesting to know where you are locating the bottom.
Do give the levels.
Regards.
 
Amit,

I could see the formation of a W that was between the mid march to mid april of 2006.

Please have a look at the following link

http://in.finance.yahoo.com/q/bc?s=TFCILTD.NS&t=6m

Let me know if I am missing something.

Thanks,
Balaji.
 
AMITBE said:
Hi Balaji...what levels are you thinking of...for the double bottom?
Would be interesting to know where you are locating the bottom.
Do give the levels.
Regards.
Hi Dear amit..
I am also having wrong idea on double bottom !!
Attaching chart please clerify. And I also want to know about
slow stock and fast stock is the both have any significence to judge
the trend? Please guide us.
 

Attachments

AMITBE

Well-Known Member
pnbalaji said:
Amit,

I could see the formation of a W that was between the mid march to mid april of 2006.

Please have a look at the following link

http://in.finance.yahoo.com/q/bc?s=TFCILTD.NS&t=6m

Let me know if I am missing something.

Thanks,
Balaji.
Hi Balaji...and Vicky,
The 'W' you are looking at appears more like a higher low/bottom.
Normally a double bottom would be made close together in terms of the bottom levels. In terms of time it can be wide apart.

On the chart, a double bottom formation has been marked on TFCIL.
As this is a bullish reversal formation, the rally that follows is quite the expected price action. The integrity of the trendline is quite visible, both above, and later breaking below it.
Once the price breaks below the trendline, it tests a level quite close to the double bottom area and attempts another rally.
That rally failed, and then another bottom is created around the same level and fails again.
Volume is not shown in the chart but you'll likely see thin volumes at the attempted rallies.

In your 'W' the bottom levels ar further apart than the bottom levels pointed out in the chart. Here 'apart' means the difference in bottom levels and not in time.

Do get back for clarifications if you like.
Regards.
 

Attachments

Hi Amit,

Had a query on Shanti gear. Had entered at 70. at that time had a stop loss at 69. then it went up to 83-84 levels and was asked to increase my stop loss to 79. now I checked and my stop loss has been hit today.

what should my strategy be

-Should I only act on closing price and sell if itc lsoes below my stop loss.

- should i again make my stop loss at 69 knwoing that the correction is not stock specific but due to entire market.

Pls Guide

Rahul
 

AMITBE

Well-Known Member
rahulg77 said:
Hi Amit,

Had a query on Shanti gear. Had entered at 70. at that time had a stop loss at 69. then it went up to 83-84 levels and was asked to increase my stop loss to 79. now I checked and my stop loss has been hit today.

what should my strategy be

-Should I only act on closing price and sell if itc lsoes below my stop loss.

- should i again make my stop loss at 69 knwoing that the correction is not stock specific but due to entire market.

Pls Guide

Rahul
At times one needs to take one's nose off the TA grind, Rahul.
There are those who trade mechanically and will exit at stop level no matter what.
I consider other factors too, but this is my own way of doing things.
I'm still in, but please don't quote me!! :)

I'd bought lower down than you, but for your entry at this point you could hold with 69 stop.
If you had exited at 79 today, you could have bought in at 71-72 again.

Learn TA, trade with extreme discipline....and keep the thinker on all the time...at times one needs to bend rules.
But again, there are many ways of doing all this.
Regards.
 
Hi Amitda,

totally agree with you. There are some positions I am still holding even if stop has hit like jaiprakash as I am very positive about the company and scripts like ankur drugs and riddhi siddhi I sold as I had purchased solely by charts.

Also I had planned to buy Jaiprakash once it touches 500 again and it is below that at 485. now its down movement is facing resistance. so looks positive once the market stops correcting.

Thank u for your advice and I agree with your view about it.

Rgds

Rahul
 
Status
Not open for further replies.
Thread starter Similar threads Forum Replies Date
F Loans 4

Similar threads