


Some Good Steals...
- Thread starter AMITBE
- Start date
- Status
- Not open for further replies.
roneeth said:
Hello Amit,
Was not at the desk today...but Greaves Cotton had a blast today with the intraday high of 399.(We had entered at 274)
Thanks and Regards
Roneeth
Was not at the desk today...but Greaves Cotton had a blast today with the intraday high of 399.(We had entered at 274)
Thanks and Regards
Roneeth
I'm holding too with stop at 346 at cmp 389.
398-406 is an important area to hold above when it gets there, where the step-up targets would be 414-422-430-438.
Do follow up when you like...will update my calls.
And great going on Elecon Engineering too!
All the best.
ganeshhity said:
Amitda,
Comments on Archies ????
any chances to make profits out of this now.....do you suggest a buy at current levels..or at a dip in the range of 152-155 (if there comes a dip).
ganeshhity
Comments on Archies ????
any chances to make profits out of this now.....do you suggest a buy at current levels..or at a dip in the range of 152-155 (if there comes a dip).
ganeshhity
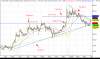
I have attached a few charts here and as there are several things going on in there, please take care to see them clearly.
Look at Archies Daily chart:
Note the Ascending Triangle formed by Trendlines 1 and 2.
Trendline 1 begins around mid April last year. The price line touches base with Trendline 1 in mid October last. About mid December last there's a breakout above Trendline 2, which is also the Line At 157. The price goes on to peak at 207 following the breakout.
Next note the Descending Triangle formed by Trendlines 3 and 4.
The priceline breaks below Trendline 3, which is also the Line At 180, in February this year. In this fall, notice how it breaks below Trendline 2 as well, meaning at 157. Interestingly, falling further the priceline touches base with Trendline 1 and takes support there end March. Bouncing off Trendline 1, the price has just broken above Trendline 4.
In fact you can make out two Descending Triangles formed by, one, Trendlines 2 and 4, and another by Trendlines 3 and 4. They are inter-related.
Now, the price in this pullback has broken above the sloping Trendline 4. But there is still the horizontal Trendline 3 at 180 to deal with. Trendline 3 also represents much congestion.
All this is visible in the weekly chart also.
If this attempted reversal is with strong momentum it may wade past the congestion. The doubt arises from the most recent daily bar which is quite non-committal, and also volume is pretty flat.
The proper way to play it would be to wait and look for strength in the move.
If the price can break above Trendline 3 at 180 and sustain it, entry could be considered with stop at 150.
On the other hand, if this turns out to be a feeble pullback, it may even break below Trendline 1.
This is how I would do it.
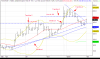
There is one more matter on interest: To zoom out the daily chart to start from April 2002, you can see a clear long range Cup&Handle formation.
The breakout in mid December is a perfect example of price action at such a bullish formation.
Now in the recent downtrend, the price had just tested support at the right rim of the 'cup' where it has bounced off the last three bars. If this turns out to be just a reflex pullback followed by a retesting of the right rim and even breaching it, this counter may turn quite bearish.
These are all possibilities at this time.
This is as best as I can comment on your query.
All the best.
Attachments
-
 20.1 KB Views: 23
 -
 15.8 KB Views: 20
 -
 19.5 KB Views: 18
AMITBE said:
Hi Roneeth...yes a great trade.
I'm holding too with stop at 346 at cmp 389.
398-406 is an important area to hold above when it gets there, where the step-up targets would be 414-422-430-438.
Do follow up when you like...will update my calls.
And great going on Elecon Engineering too!
All the best.
I'm holding too with stop at 346 at cmp 389.
398-406 is an important area to hold above when it gets there, where the step-up targets would be 414-422-430-438.
Do follow up when you like...will update my calls.
And great going on Elecon Engineering too!
All the best.
Noted the levels and thanks for the same.
Regards
Roneeth
Hi Amit,
Could you please help me with these scrips with immediate targets (1month) and with strict stop loses
IDBI @ 83
BOI @ 131
SIRPAPER @ 101
Regards
sjoshi
Hi Amit,
I took off my positions from BOI@132 and IDBI@85 on monday. Still holding Sirpaper.
Can you please advice on this.
Regards
sjoshi
Could you please help me with these scrips with immediate targets (1month) and with strict stop loses
IDBI @ 83
BOI @ 131
SIRPAPER @ 101
Regards
sjoshi
Hi Amit,
I took off my positions from BOI@132 and IDBI@85 on monday. Still holding Sirpaper.
Can you please advice on this.
Regards
sjoshi
Last edited:
AMITBE said:
Ganesh my friend...I'm trying to keep away from this thread for queries etc for some time. However you've drawn me back here this time...I'm aware you've queried Archies earlier too.
I have attached a few charts here and as there are several things going on in there, please take care to see them clearly.
Look at Archies Daily chart:
Note the Ascending Triangle formed by Trendlines 1 and 2.
Trendline 1 begins around mid April last year. The price line touches base with Trendline 1 in mid October last. About mid December last there's a breakout above Trendline 2, which is also the Line At 157. The price goes on to peak at 207 following the breakout.
Next note the Descending Triangle formed by Trendlines 3 and 4.
The priceline breaks below Trendline 3, which is also the Line At 180, in February this year. In this fall, notice how it breaks below Trendline 2 as well, meaning at 157. Interestingly, falling further the priceline touches base with Trendline 1 and takes support there end March. Bouncing off Trendline 1, the price has just broken above Trendline 4.
In fact you can make out two Descending Triangles formed by, one, Trendlines 2 and 4, and another by Trendlines 3 and 4. They are inter-related.
Now, the price in this pullback has broken above the sloping Trendline 4. But there is still the horizontal Trendline 3 at 180 to deal with. Trendline 3 also represents much congestion.
All this is visible in the weekly chart also.
If this attempted reversal is with strong momentum it may wade past the congestion. The doubt arises from the most recent daily bar which is quite non-committal, and also volume is pretty flat.
The proper way to play it would be to wait and look for strength in the move.
If the price can break above Trendline 3 at 180 and sustain it, entry could be considered with stop at 150.
On the other hand, if this turns out to be a feeble pullback, it may even break below Trendline 1.
This is how I would do it.
There is one more matter on interest: To zoom out the daily chart to start from April 2002, you can see a clear long range Cup&Handle formation.
The breakout in mid December is a perfect example of price action at such a bullish formation.
Now in the recent downtrend, the price had just tested support at the right rim of the 'cup' where it has bounced off the last three bars. If this turns out to be just a reflex pullback followed by a retesting of the right rim and even breaching it, this counter may turn quite bearish.
These are all possibilities at this time.
This is as best as I can comment on your query.
All the best.
thanks amitda for quick response...I have done homework on this stock....still not able to conclude at it's movements......better stay away..
thanks once more..
ganeshhity
AMITBE said:
Ganesh my friend...I'm trying to keep away from this thread for queries etc for some time. However you've drawn me back here this time...I'm aware you've queried Archies earlier too.
I have attached a few charts here and as there are several things going on in there, please take care to see them clearly.
Hello Amit,
Thanks for the in Analysis of archies, Had also entered but had got stopped out a month ago.
Appreciate your efforts for taking time and posting the charts too.
Greaves had a high of 414 today...and closed at 378.
Thanks and Regards
Roneeth
roneeth said:
AMITBE said:
Hello Amit,
Thanks for the in Analysis of archies, Had also entered but had got stopped out a month ago.
Appreciate your efforts for taking time and posting the charts too.
Greaves had a high of 414 today...and closed at 378.
Thanks and Regards
Roneeth
Thanks for the in Analysis of archies, Had also entered but had got stopped out a month ago.
Appreciate your efforts for taking time and posting the charts too.
Greaves had a high of 414 today...and closed at 378.
Thanks and Regards
Roneeth
The previously mentioned stop at 346, or even 340 are good. 299-305 is strong too but too far down from here. Stop out if the markets turn down and be ready to get on again later. The step up levels are on too, and it did touch 414 on Friday,
All the best.
AMITBE said:
roneeth said:
Hi Roneeth...Greaves closed at 384 and is a strong hold as there's more left here over a period of consolidation.
The previously mentioned stop at 346, or even 340 are good. 299-305 is strong too but too far down from here. Stop out if the markets turn down and be ready to get on again later. The step up levels are on too, and it did touch 414 on Friday,
All the best.
The previously mentioned stop at 346, or even 340 are good. 299-305 is strong too but too far down from here. Stop out if the markets turn down and be ready to get on again later. The step up levels are on too, and it did touch 414 on Friday,
All the best.
Have Noted down the levels.
Thanks and Regards
Roneeth
mail2joshi said:
Hi Amit,
Could you please help me with these scrips with immediate targets (1month) and with strict stop loses
IDBI @ 83
BOI @ 131
SIRPAPER @ 101
Regards
sjoshi
Could you please help me with these scrips with immediate targets (1month) and with strict stop loses
IDBI @ 83
BOI @ 131
SIRPAPER @ 101
Regards
sjoshi
I took off my positions from BOI@132 and IDBI@85 on monday. Still holding Sirpaper.
Can you please advice on this.
Regards
sjoshi
- Status
- Not open for further replies.
| Thread starter | Similar threads | Forum | Replies | Date |
|---|---|---|---|---|
| F | Do you know that HDFCBANK,ICICIBANK OR ANY HI FI BANK LITERALLY STEALS YOUR MONEY | Loans | 4 |
Similar threads
-
Do you know that HDFCBANK,ICICIBANK OR ANY HI FI BANK LITERALLY STEALS YOUR MONEY
- Started by ford7k
- Replies: 4