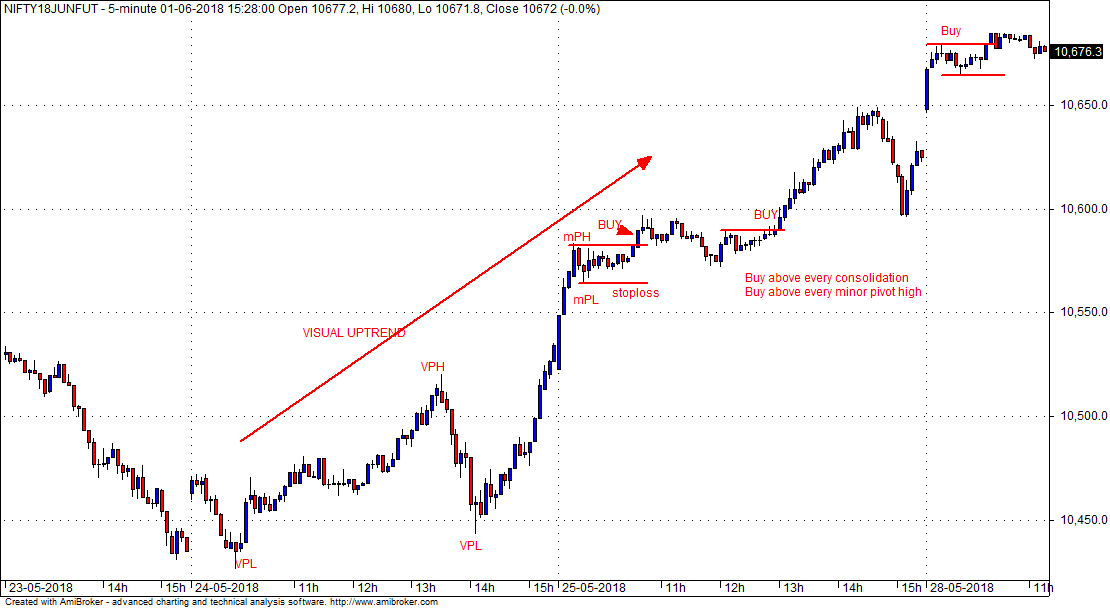
I have observed few traders trading pivot method think that for everyday you need a visual pivot to take a trade. This is incorrect. The method trades minor trends in the direction of visual trend. So when the visual trend gets defined, we have to trade each minor pivot in the direction of visual trade.
The chart shows that the visual trend changed to up on 24-5-2018. When we start trading on 25-5-2018, we know that the visual trend is up...so we look for place to buy based on following :
1) Minor uptrend....buy above minor pivot high...our initial stoploss is the immediate preceding minor pivot low.
2) Look for small consolidation and buy above the consolidation area.
Our first entry is above a small horrizontal consolidation......stoploss level is shown. In case one misses the first entry, we can have a second entry above a minor pivot high as shown...
The pivot method works best in trending markets. We need to have good trending moves in either direction. Most losses on this method ( like ny other trend following method ) are when traders trade this method in sideways markets. Here we are buying breakouts.....so in weak sideways markets, by the time we buy a breakout, the trend ends...so a trader has to first understand what is the market structure, is the market trending or sideways...how strong is the trend and then in sideways markets use support /resistances, VWAP bands previous days high/low, failures at important levels etc.....
How does one know the strength of the trend ? Traders can find that just looking at the chart but few pointers are as under :
1) Market making very small bars ,failing at breakouts/breakdowns.
2) Market remaining in 2 visual pivots for a long time .
3) Market making bars with long tails but small bodies.
4) Market barely going upto support/resistance levels and that too with great difficulty.
5) Market printing alternate red and green bars, both small bars....
6) ATR of the bar in your timeframe can give clues of the strength of the trend.
Traders by practice know how much move trending market gives in 5/10 or 15 min in nifty and bank nifty....so if the move is not strong, trade light in quantity and be quick to take profits......in strongly trending markets one can think of adds and holding till the end but in weak markets ( most of the times markets show weak trends these days) one has to grab the profits else it will disappear. If the market is staying in two visual pivots for a long time, then it is a danger sign that the trend is loosing strength.Trade the full quantity is a strong trend and lower qty in a sideways market....
We have seen that ERLs are not to be used in sideways markets but ERLs can be very effectively used in a trending market for catching a reversal at an early stage by pivot upgradation......we will discuss how to do it in the next weekend.
There is only one exception to what is said in the first para above. When the market closes strongly at the higher/lower end and next day it opens with a gap into the previous days afternoon range, here we need to wait till visual pivot is formed as the gap changes the supply/demand equation.
Smart_trade


