_SECTION_BEGIN("Price");
SetChartOptions(0,chartShowArrows|chartShowDates);
_N(Title = StrFormat("{{NAME}} - {{INTERVAL}} {{DATE}} Open %g, Hi %g, Lo %g, Close %g (%.1f%%) {{VALUES}}", O, H, L, C, SelectedValue( ROC( C, 1 ) ) ));
Plot( C, "Close", ParamColor("Color", colorDefault ), styleNoTitle | ParamStyle("Style") | GetPriceStyle() );
// change percentage of plus n minus from parameter window :)
aa = Param("percent",5,0.1,1000,0.1);
// plot ema 50
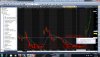
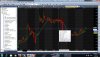
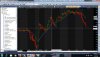
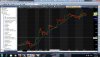
Plot(EMA(C,50),"",colorRed,styleLine);
// percentage of ema 50
p = (aa*100)/(EMA(C,50));
// plotting plus minus percentage lines of ema 50 :)
Plot(EMA(C,50)-p,"",colorYellow,styleLine);
Plot(EMA(C,50)+p,"",coloryellow,styleLine);
// close must be more than or equal to ema50 + minus% and
// close must be less than or equal to ema50 + plus%
cond = C>=(EMA(C,50) - p) AND C<= (EMA(C,50) + p);
// plotting arrow for visual confirmation :D
PlotShapes(IIf(cond,shapeUpArrow,shapeNone),colorWhite,0,L,-12);
// use in analysis
Filter = cond;
AddColumn(c,"Close",1.2);
AddColumn(EMA(C,50),"EMA 50 ^_^",1.2);


")