Simple Coding Help - No Promise.

Hey guys,

I built this code, but I have a problem with my trailingstop part, it trigger in some situations I won't, like after a sell it trigger a short, or after a buy it trigger a cover.

So a tried put Exrem() function to solve, but doesn't work, maybe because are some conflit in my code as I using Exrem() in two other moments.

Please help.

Vinicius
 

Attachments

cellclinic

Well-Known Member
Happy Jee & Experts ... Please Help !!!

The basic code.Not very attractive.
Needs to be refined by an expert.

Code:
_SECTION_BEGIN("Price");
SetChartOptions(0,chartShowArrows|chartShowDates);
_N(Title = StrFormat("{{NAME}} - {{INTERVAL}} {{DATE}} Open %g, Hi %g, Lo %g, Close %g (%.1f%%) Vol " +WriteVal( V, 1.0 ) +" {{VALUES}}", O, H, L, C, SelectedValue( ROC( C, 1 )) ));
Plot( C, "Close", ParamColor("Color", colorDefault ), styleNoTitle | ParamStyle("Style") | GetPriceStyle() ); 
_SECTION_END();

_SECTION_BEGIN("DONCHAIN1");
// Plots a 20 period Donchian channel

pds=144;
DonchianUpper =HHV(Ref(C,-1),pds);
DonchianLower = LLV(Ref(C,-1),pds);
DonchianMiddle = (DonchianUpper+DonchianLower)/2;


Plot(DonchianUpper,"DU",colorGreen,styleLine);
Plot(DonchianMiddle,"DM",colorViolet,styleNoDraw);
Plot(DonchianLower,"DL",colorRed,styleLine);

_SECTION_BEGIN("DONCHAIN2");
// Plots a 20 period Donchian channel

pds1=720;
DonchianUpper1 =HHV(Ref(C,-1),pds1);
DonchianLower1 = LLV(Ref(C,-1),pds1);
DonchianMiddle1 = (DonchianUpper1+DonchianLower1)/2;


Plot(DonchianUpper1,"DU1",colorDarkRed,styleThick);
Plot(DonchianMiddle1,"DM1",colorWhite,styleNoDraw);
Plot(DonchianLower1,"DL1",colorRed,styleThick);
Buy=Cross(C,DonchianUpper);
Buy1=Cross(C,DonchianUpper1);
Sell=Cross(DonchianLower,C);
Sell1=Cross(DonchianLower1,C);
Buy=Buy OR Buy1;
Sell=Sell OR Sell1;
Buy = ExRem(Buy, Sell);
Sell = ExRem(Sell, Buy);
shape = Buy * shapeUpArrow + Sell * shapeDownArrow;
 PlotShapes( shape, IIf( Buy, colorGreen, colorRed ), 0, IIf( Buy, Low, High ) );
PopupWindow("Buy : " + FullName(),"BUY", 5, 640*mtRandom(), 480*mtRandom());
PopupWindow("Sell : " + FullName(),"SELL", 5, 640*mtRandom(), 480*mtRandom());
Thanks Amit for supporting once again ..

sorry for not providing buy & sell conditions as it skipped from mind .;)

If Possible :- 2 Buy Signal ( Differently Colored )

Buy 1 if price closed & trade above Donchian 144 upper band .

Buy 2 if price closed & trade above Donchian 720 upper band .

Sell1 if price closed & trade below Donchian 144 lower band .

Sell2 if price closed & trade below Donchian 720 lower band .

Addition With alert :)
 
hey guys i am new here , read your thread as unregistered member and i must say very impressive helpful people here.

can the experts help me in getting a moving average crossover afl for amibroker which could combine multiple time frame crossover signal on 1 intraday chart ?

say sell signal of 1 hour crossover of any moving average crossover system + sell of 15 minute same system , can they both be shown as +2 on intraday chart (+2 because 1 hour and 15 minutes both are sell)

thanks :)
 

amandeep86

Well-Known Member
Hello Seniors,

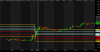
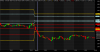
I m using Pivots points Code to display them on my charts .Just want to add an toggle option in my afl ,to display only today's Pivot levels and not for the previous days.

This would save a lot of clutter and compression on my charts .

Afl Posted as below :-

_SECTION_BEGIN("Robert's Pivot Points");

//---------------------------------------------------------------------------
// Pivot Pointer
//---------------------------------------------------------------------------
// Now a days each and every trader wants pivot levels for thier day
// trading.But the main feature in this afl is you can get all types of
// pivot point in a single afl, Some of the traders use Woodie pivot,
// caramilla pivot, Fibonacci pivot and most of them used Classical
// pivot, i think this afl will solve all your needs.
//---------------------------------------------------------------------------

//---------------------------------------------------------------------------

//---------------------------------------------------------------------------

//---------------------------------------------------------------------------
// This section gets whether they want pivot level for intraday or thier eod
//---------------------------------------------------------------------------

_N(ioreod =ParamList("Pivot Levels for ", "Intraday|EOD"));

if (ioreod=="Intraday")
{
yh = TimeFrameGetPrice( "H", inDaily, -1 );
yl = TimeFrameGetPrice( "L", inDaily, -1 );
yc = TimeFrameGetPrice( "C", inDaily, -1 );
}
else
{
yh = TimeFrameGetPrice( "H", inDaily, 0 );
yl = TimeFrameGetPrice( "L", inDaily, 0 );
yc = TimeFrameGetPrice( "C", inDaily, 0 );
}

//---------------------------------------------------------------------------
// To calculate the Pivot Levels
//---------------------------------------------------------------------------

to = TimeFrameGetPrice( "O", inDaily, 0 );
pivot = (yh + yl + yc) / 3;
range = yh - yl;
_N(pist =ParamList("Select Pivot Type ", "Classical Pivot|Woodie
Pivot|Caramilla Pivot|Fibonacci Pivot"));

if (pist =="Classical Pivot" )
{
r1 = (2 * pivot) - yl ;
s1 = (2 * pivot) - yh ;
r2 = pivot - s1 + r1;
s2 = pivot - (r1 - s1) ;
r4=r3 = 2 * (pivot - yl) + yh ;
s4=s3 = yl - (2 * (yh - pivot));
}

else if(pist =="Woodie Pivot" )
{
pivot = (yh + yl + yc + to) / 4;
r1 = (2 * pivot) - yl;
r2 = pivot + range;
r3 = yh + 2 * (pivot - yl);
r4 = r3 + range;
s1 = (2 * pivot) - yh;
s2 = pivot - range;
s3 = yl - 2 * (yh - pivot);
s4 = S3 - range;
}

else if(pist =="Caramilla Pivot" )
{
r4 = yc + range * 1.1/2;
r3 = yc + range * 1.1/4;
r2 = yc + range * 1.1/6;
r1 = yc + range * 1.1/12;
s1 = yc - range * 1.1/12;
s2 = yc - range * 1.1/6;
s3 = yc - range * 1.1/4;
s4 = yc - range * 1.1/2;
}

else
{
r4= pivot + 1.382 * (yh - yl);
r3 = pivot + 1.000 * (yh - yl);
r2 = pivot + 0.618 * (yh - yl);
r1 = pivot + 0.382 * (yh - yl);
s1 = pivot - 0.382 * (yh - yl);
s2 = pivot - 0.618 * (yh - yl);
s3 = pivot - 1.000 * (yh - yl);
s4 = pivot - 1.382 * (yh - yl);

}

//---------------------------------------------------------------------------
// To Plot Pivot Levels in the screen
//---------------------------------------------------------------------------

_N(dsr =ParamList("Draw Intraday Pivot Levels ",
"None|Both|Support|Resistance"));

if (dsr =="Support" OR dsr == "Both")
{
Plot(pivot, "\n Pivot - ",colorGreen,styleDots+styleNoRescale,1);
Plot(r1, "Resistance 1 - ",colorDarkRed,1);
Plot(r2, "Resistance 2 - ",colorDarkRed,styleDots+styleNoRescale,1);
Plot(r3, "Resistance 3 - ",colorDarkRed,1);
Plot(r4, "Resistance 4 - ",colorDarkRed,styleDots+styleNoRescale,1);

Plot((pivot+r1)/2, "Mid Value of R1 & Pivot ",colorLightBlue,styleDashed,1);
Plot((r4+r3)/2, "Mid Value of R4 & R3 - ",colorLightBlue,styleDashed,1);
Plot((r3+r2)/2, "Mid Value of R2 & R3 - ",colorLightBlue,styleDashed,1);
Plot((r1+r2)/2, "Mid Value of R1 & R2 - ",colorLightBlue,styleDashed,1);
}

if( dsr == "Resistance" OR dsr == "Both")
{
Plot(pivot, " \n Pivot - ",colorGreen,styleDots+styleNoRescale,1);
Plot(s4, "Support 4 - ",colorDarkBlue,styleDots+styleNoRescale,1);
Plot(s3, "Support 3 - ",colorDarkBlue,1);
Plot(s2, "Support 2 - ",colorDarkBlue,styleDots+styleNoRescale,1);
Plot(s1, "Support 1 - ",colorDarkBlue,1);
Plot((s4+s3)/2, "Mid Value of S4 & S3 ",colorLightBlue,styleDashed,1);
Plot((s3+s2)/2, "Mid Value of S2 & S3 ",colorLightBlue,styleDashed,1);
Plot((s1+s2)/2, "Mid Value of S1 & S2 - ",colorLightBlue,styleDashed,1);
Plot((pivot+s1)/2, "Mid Value of S1 & Pivot ",colorLightBlue,styleDashed,1);
}

//---------------------------------------------------------------------------
// Printing the pivot level in interpretation window
//---------------------------------------------------------------------------


//printf(Name()+ "\n\nResistance - 3 | %g\nResistance - 2 | %g\nResistance -1 | %g\n" + "Pivot | %g\nSupport - 1 | %g\nSupport - 2 | %g\nSupport - 3 | %g",r3,r2,r1,pivot,s1,s2,s3);


//---------------------------------------------------------------------------
// This section is for Exploration
//---------------------------------------------------------------------------

Filter = 1;
AddColumn(r3,"Resistance 3");
AddColumn(r2,"Resistance 2");
AddColumn(r1,"Resistance 1");
AddColumn(Pivot,"Pivot");
AddColumn(s1,"Support 1");
AddColumn(s2,"Support 2");
AddColumn(s3,"Support 3");

//---------------------------------------------------------------------------
// Add Pivot levels along with the title
//---------------------------------------------------------------------------
/*
_N(Title = EncodeColor(colorBrown)+ StrFormat("{{NAME}} - {{INTERVAL}} {{DATE}}
Open %g, Hi %g, Lo %g, Close %g(%.1f%%)\n"+
EncodeColor(4)+"Resistance 3 -=- %g ::::: Resistance 2 -=- %g ::::: Resistance
1 -=- %g :::::"+
EncodeColor(colorGreen)+" Pivot -=- %g"+
EncodeColor(29)+"\nSupport 1 -=- %g ::::: Support 2 -=- %g ::::: Support 3 -=-
%g\n ",
O, H, L, C,SelectedValue( ROC( C, 1 ) ),r3,r2,r1,pivot,s1,s2,s3));

//---------------------------------------------------------------------------
// End of Pivot Point
//---------------------------------------------------------------------------
*/
_SECTION_END();
 
SetBarsRequired(100000,100000);
//------------------------------------------------------------------+
// Block 1 |
//------------------------------------------------------------------+
VR=ParamToggle("View Renko","Bricks|Lines/Bars",0);
FV=Param("Initial size volatility",0.5,0.001,50,0.001);
MV=Param("Method calculation volatility",0,0,2,1);
PeriodVol=Param("Period calculation volatility",14,2,100,1);
Multiplier=Param("Multiplier volatility",1,0.1,10,0.1);
MR=ParamToggle("Method Renko","floating|fixed",1);
SG=ParamToggle("Show gap","No|Yes",1);
CG=ParamColor("Colour show gap",11);
MaxBS=Param("Maximum size brick",0,0,10,0.1);
MinBS=Param("Minimum size brick",0,0,10,0.1);
RenkoUp=ParamColor("Colour Renko upwards",colorBlack);
RenkoDown=ParamColor("Colour Renko downwards",colorBlack);
SB=ParamStyle("View bars",defaultval=styleCandle,mask=maskPrice);
color3=ParamColor("Colour bars",colorBlack);
History=Param("History size",5000,2,BarCount-1,1);
//------------------------------------------------------------------+
// Block 2 |
//------------------------------------------------------------------+
i=Max(BarCount-1-History,PeriodVol+1);
r=j=0;
direction=0;
iGapUp=iGapDown=0;
rOpen[0]=rHigh[0]=rLow[0]=rClose[0]=jUp=jDown=Open;
//-------------------------------------------------------------------
switch(MV)
{
case 0: Volatility=FV; break;
case 1: Volatility=ATR(PeriodVol)*Multiplier; break;
case 2: Volatility=StDev(Open,PeriodVol)*Multiplier; break;
}
BrickSize=Volatility[i-1];
//-------------------------------------------------------------------+
// Block 3 |
//-------------------------------------------------------------------+
while(i<=BarCount-1)
{
if(SG==1)
{
if(High[i-1]<Low)
{
iGapUp=1;
}
else
{
if(Low[i-1]>High)
{
iGapDown=1;
}
}
}
//-------------------------------------------------------------------
if(MR==0)
{
BrickSize=Volatility[i-1];
if(MaxBS>0) {BrickSize=Min(MaxBS,BrickSize);}
if(MinBS>0) {BrickSize=Max(MinBS,BrickSize);}
}
//------------------------------------------------------------------+
// Block 4 |
//------------------------------------------------------------------+
if(direction==0)
{
if(Open-rClose[r]>BrickSize)
{
rClose[r]=rOpen[r]+BrickSize;
rHigh[r]=rClose[r];
direction=1;
//-------------------------------------------------------------------
BrickSize=Volatility;
if(MaxBS>0) {BrickSize=Min(MaxBS,BrickSize);}
if(MinBS>0) {BrickSize=Max(MinBS,BrickSize);}
//-------------------------------------------------------------------
if(iGapUp==1|iGapDown==1)
{
color[r]=CG;
}
else
{
color[r]=RenkoUp;
}
continue;
}
//-------------------------------------------------------------------
else
{
if(rClose[r]-Open>BrickSize)
{
rClose[r]=rOpen[r]-BrickSize;
rLow[r]=rClose[r];
direction=2;
//-------------------------------------------------------------------
BrickSize=Volatility;
if(MaxBS>0) {BrickSize=Min(MaxBS,BrickSize);}
if(MinBS>0) {BrickSize=Max(MinBS,BrickSize);}
//-------------------------------------------------------------------
if(iGapUp==1|iGapDown==1)
{
color[r]=CG;
}
else
{
color[r]=RenkoDown;
}
continue;
}
}
}
//------------------------------------------------------------------+
// Block 5 |
//------------------------------------------------------------------+
else
{
if(direction==1)
{
if(rOpen[r]-Open>BrickSize)
{
r++;
rOpen[r]=rOpen[r-1];
rHigh[r]=rOpen[r];
rClose[r]=rOpen[r]-BrickSize;
rLow[r]=rClose[r];
direction=2;
//-------------------------------------------------------------------
BrickSize=Volatility;
if(MaxBS>0) {BrickSize=Min(MaxBS,BrickSize);}
if(MinBS>0) {BrickSize=Max(MinBS,BrickSize);}
//-------------------------------------------------------------------
if(iGapUp==1|iGapDown==1)
{
color[r]=CG;
}
else
{
color[r]=RenkoDown;
}
continue;
}
//-------------------------------------------------------------------
else
{
while(Open-rClose[r]>BrickSize)
{
r++;
rOpen[r]=rClose[r-1];
rLow[r]=rOpen[r];
rClose[r]=rOpen[r]+BrickSize;
rHigh[r]=rClose[r];
//-------------------------------------------------------------------
BrickSize=Volatility;
if(MaxBS>0) {BrickSize=Min(MaxBS,BrickSize);}
if(MinBS>0) {BrickSize=Max(MinBS,BrickSize);}
//-------------------------------------------------------------------
if(iGapUp==1|iGapDown==1)
{
color[r]=CG;
}
else
{
color[r]=RenkoUp;
}
}
}
}
//------------------------------------------------------------------+
// Block 6 |
//------------------------------------------------------------------+
else
{
if(direction==2)
{
if(Open-rOpen[r]>BrickSize)
{
r++;
rOpen[r]=rOpen[r-1];
rLow[r]=rOpen[r];
rClose[r]=rOpen[r]+BrickSize;
rHigh[r]=rClose[r];
direction=1;
//-------------------------------------------------------------------
BrickSize=Volatility;
if(MaxBS>0) {BrickSize=Min(MaxBS,BrickSize);}
if(MinBS>0) {BrickSize=Max(MinBS,BrickSize);}
//-------------------------------------------------------------------
if(iGapUp==1|iGapDown==1)
{
color[r]=CG;
}
else
{
color[r]=RenkoUp;
}
continue;
}
//-------------------------------------------------------------------
else
{
while(rClose[r]-Open>BrickSize)
{
r++;
rOpen[r]=rClose[r-1];
rHigh[r]=rOpen[r];
rClose[r]=rOpen[r]-BrickSize;
rLow[r]=rClose[r];
//-------------------------------------------------------------------
BrickSize=Volatility;
if(MaxBS>0) {BrickSize=Min(MaxBS,BrickSize);}
if(MinBS>0) {BrickSize=Max(MinBS,BrickSize);}
//-------------------------------------------------------------------
if(iGapUp==1|iGapDown==1)
{
color[r]=CG;
}
else
{
color[r]=RenkoDown;
}
}
}
}
}
}
//------------------------------------------------------------------+
// Block 7 |
//------------------------------------------------------------------+
if(VR==1)
{
jOpen[j]=Open;
jHigh[j]=High;
jLow[j]=Low;
jClose[j]=Close;
//-------------------------------------------------------------------
if(direction==1)
{
jUp[j]=rClose[r];
jDown[j]=rOpen[r];
color2[j]=color[r];
}
else
{
if(direction==2)
{
jUp[j]=rOpen[r];
jDown[j]=rClose[r];
color2[j]=color[r];
}
}
j++;
}
i++;
}
//------------------------------------------------------------------+
// Block 8 |
//------------------------------------------------------------------+
if(VR==1)
{
delta=BarCount-j;
jOpen=Ref(jOpen,-delta);
jHigh=Ref(jHigh,-delta);
jLow=Ref(jLow,-delta);
jClose=Ref(jClose,-delta);
jUp=Ref(jUp,-delta);
jDown=Ref(jDown,-delta);
color2=Ref(color2,-delta);
SetChartOptions(0,chartShowArrows|chartShowDates);
_N(Title = StrFormat("{{NAME}} - {{INTERVAL}} {{DATE}} Open %g, Hi %g, Lo %g, Close %g (%.1f%%) {{VALUES}}", O, H, L, C, SelectedValue( ROC( C, 1 ) ) ));
PlotOHLC(jOpen,jHigh,jLow,jClose,"SRI",color3,SB);
Plot(jUp,"Up",color2,styleThick);
Plot(jDown,"Down",color2,styleThick);
}
//-------------------------------------------------------------------
else
{
delta=BarCount-1-r;
rOpen=Ref(rOpen,-delta);
rHigh=Ref(rHigh,-delta);
rLow=Ref(rLow,-delta);
rClose=Ref(rClose,-delta);
color=Ref(color,-delta);
PlotOHLC(rOpen,rHigh,rLow,rClose,"SRI",color,styleCandle);

}


the above is renko bars afl . but when i plot on my chart it shows errors . please help
 

amitrandive

Well-Known Member
SetBarsRequired(100000,100000);
/.
.
.
.
mToggle("Show gap","No|Yes",1);


the above is renko bars afl . but when i plot on my chart it shows errors . please help


A working Renko AFL

:thumb:

Code:
_SECTION_BEGIN("Renko");
// Renko Chart
// Graham Kavanagh 13 Aug 2004 ver C
// Custom Indicator, date axis does not apply


SetBarsRequired(10000,10000);
// Brick size is dependant on what you want, if too small will not produce a chart due to insufficient x-axis bars
Brick = LastValue( ATR(100) ); /// <<<< This line should not be commented out.
//Brick = LastValue( Max(0.02*C, 0.05) );
//Brick = Param( "Brick Size", 1, 10, 2000, 1500); <<<< You should comment this out
reverse = 2;

// Convert the closing price to rising and falling rounded bricks
CF = ceil(C/Brick);
CR = floor(C/Brick);

// initialize first element
j = 0;
RKC[j] = CF[0];
RKO[j] = CF[0] + 1;

down[j] = 1; // By default the first bar is a down bar.
up[j] = 0;

// Loop to produce the Renko values in number of bricks

for( i=1; i<BarCount-1; i++ )
{
if( CF[i] <= RKC[j] - 1 && down[j] ) // Continue down
{
num = RKC[j] - CF[i];
for( x=1; x<=num; x++ )
{
j++;
up[j] = 0;
down[j] = 1;
RKC[j] = RKC[j-1] - 1;
RKO[j] = RKC[j] + 1;
}
}
else
{
if( CR[i] >= RKC[j] + Reverse && down[j] ) // Change down to up
{
num = CR[i] - RKC[j];
j++;
up[j] = 1;
down[j] = 0;
RKC[j] = RKC[j-1] + 2;
RKO[j] = RKC[j] - 1;
for( x=2; x<=num; x++ )
{
j++;
up[j] = 1;
down[j] = 0;
RKC[j] = RKC[j-1] + 1;
RKO[j] = RKC[j] - 1;
}
}
else
{
if( CR[i] >= RKC[j] + 1 && up[j] ) // Continue Up
{
num = CR[i] - RKC[j];
for( x=1; x<=num; x++ )
{
j++;
Up[j] = 1;
Down[j] = 0;
RKC[j] = RKC[j-1] + 1;
RKO[j] = RKC[j] - 1;
}
}
else
{
if( CF[i] <= RKC[j] - Reverse && up[j] ) // Change up to down
{
num = RKC[j] - CF[i];
j++;
Up[j] = 0;
Down[j] = 1;
RKC[j] = RKC[j-1] - 2;
RKO[j] = RKC[j] + 1;
for( x=2; x<=num; x++ )
{
j++;
up[j] = 0;
down[j] = 1;
RKC[j] = RKC[j-1] - 1;
RKO[j] = RKC[j] + 1;
}
}
}
}
}
}


// move the chart to right end of chart space, ie last brick on last bar position
delta = BarCount-1 - j;

RKC = Ref( RKC, -delta );
RKO = Ref( RKO, -delta );

Up = Ref( Up, -delta );
Down = Ref( Down, -delta );

/*
rC = RKC * Brick;// + (Up-down)*Brick/2;
rO = RC - (Up-down)*Brick;
rH = Max(rC,rO);
rL = Min(rC,rO);
*/


C = RKC * Brick;// + (Up-down)*Brick/2;
O = C - (Up-down)*Brick;
H = Max(C,O);
L = Min(C,O);

Plot( C, "", colorGrey50,styleCandle);
// plot chart
//plotOHLC( rO, rH, rL, rC, "Renko Price " , colorBlack, styleCandle);
GraphXSpace=5;

Title = Name() + " - {{INTERVAL}} {{DATE}} - Renko Chart : Last Value = " + RKC * Brick + ", Brick Size = " + Brick;
_SECTION_END();
 

bunti_k23

Well-Known Member
Sum1 plz tell how to add the backtesting function (code) in any afl i have proper buy sell cover and rules....
 

Similar threads