Price action with Candlestick Analysis(No indicators)

cellclinic

Well-Known Member
Welcome Bro ...

I am also a learner here :-D ... Rest i writes comments mostly on pics i posts or marks areas like i posted nifty 1 hour chart with black support lines drawn on that .... :)

Regarding Your chart it seems breakdown failure & can be traded long ... With CAUTION ( because this is market :-D ) ....

Continue posting charts :clapping:

Hey cellclinic, some explanation with charts will be of great help for those who are still learning like me.
Please also have a look at my above post and comment.

For now, I am just going with the basics and trying simple things.
 

cellclinic

Well-Known Member
Hammer always comes in downtrend @ bottom & Shooting star Must be in uptrend @ top :)

If you can ... download candle dvd's by Mr. Steeve Nisson ... You can get link from my signatures .... :thumb:

Hey cellclinic, On Nifty daily spot that you draw, Is that a shooting star or a hammer?

I think it's a hammer and with a white body, just something that I read on a site.
In cases where a major uptrend followed by a Hammer exists, the investor should consider vacating short positions.
 
Hammer always comes in downtrend @ bottom & Shooting star Must be in uptrend @ top :)

If you can ... download candle dvd's by Mr. Steeve Nisson ... You can get link from my signatures .... :thumb:
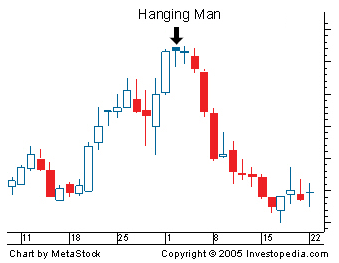
Just googled it and I think it's a hanging man.


Definition of 'Hanging Man'
A bearish candlestick pattern that forms at the end of an uptrend. It is created when there is a significant sell-off near the market open, but buyers are able to push this stock back up so that it closes at or near the opening price. Generally the large sell-off is seen as an early indication that the bulls (buyers) are losing control and demand for the asset is waning.


If hanging man pattern is found at the end of a downtrend, it is known as a "hammer".

This formation does not mean that the bulls have definitively lost control, but it may be an early sign that the momentum is decreasing and the direction of the asset may be getting ready to change. The reliability of this signal is drastically improved when the price of the asset decreases the day after the signal. Hanging man formations can be more easily identified in intraday charts than daily charts and are a very popular formation used by day traders.
 

cellclinic

Well-Known Member
Pick your own choice to read or watch 4hrs ( approx ) dvd where Mr . Steeve Nisson described everything in brief ... Secrets To Becoming A Samurai Trader in the torrent ( which you can find in my signature ) just download pdf or the complete set & watch it on this sat & sunday & just share your experience of learning with all of us to motivate :)

OR ... read pdf kind of ( not Mr. Steeve's pdf ) here ...

http://stockcharts.com/school/doku.php?id=chart_school:chart_analysis:introduction_to_candlesticks

Just googled it and I think it's a hanging man.


Definition of 'Hanging Man'
A bearish candlestick pattern that forms at the end of an uptrend. It is created when there is a significant sell-off near the market open, but buyers are able to push this stock back up so that it closes at or near the opening price. Generally the large sell-off is seen as an early indication that the bulls (buyers) are losing control and demand for the asset is waning.


If hanging man pattern is found at the end of a downtrend, it is known as a "hammer".

This formation does not mean that the bulls have definitively lost control, but it may be an early sign that the momentum is decreasing and the direction of the asset may be getting ready to change. The reliability of this signal is drastically improved when the price of the asset decreases the day after the signal. Hanging man formations can be more easily identified in intraday charts than daily charts and are a very popular formation used by day traders.
 
Re: Long - Medium Term : Price Action & Wolf Wave ( Pre Mature Patterns )

SBI DAILY :


All friends are requested not to jump before pattern gets completed i any chart posted from here on ... I will try to update as much possible also in real time ...

:thumb:

Update :

Catching a developing WW, how far it gives good results?
 
Pick your own choice to read or watch 4hrs ( approx ) dvd where Mr . Steeve Nisson described everything in brief ... Secrets To Becoming A Samurai Trader in the torrent ( which you can find in my signature ) just download pdf or the complete set & watch it on this sat & sunday & just share your experience of learning with all of us to motivate :)

OR ... read pdf kind of ( not Mr. Steeve's pdf ) here ...

http://stockcharts.com/school/doku.php?id=chart_school:chart_analysis:introduction_to_candlesticks
How about calling it as "lolipop candle", much simpler way, 'Bear shows lolipop to bull' and sellings starts till bulls finished eating lolipop given by Bears
 
Last edited:

cellclinic

Well-Known Member
its up to you ... but as technicals we can read this as technical word or particular name ... as mom will always be mom ... as per ur suitability one might be not agreed :)

How about calling it as "lolipop candle", much simpler way, 'Bear shows lolipop to bull' and sellings starts till bulls finished eating lolipop given by Bears
 
Last edited:

cellclinic

Well-Known Member
Re: Long - Medium Term : Price Action & Wolf Wave ( Pre Mature Patterns )

Update : 300 min sbi


SBI DAILY :


All friends are requested not to jump before pattern gets completed i any chart posted from here on ... I will try to update as much possible also in real time ...

:thumb:

Update :
 

Similar threads