


SH's 315 Strategy - how to use if effectively
- Thread starter Tradewithhunter
- Start date
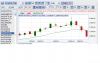
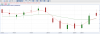
I shorted dlf around 304 booked next day as candle not touching 3ema.Then again shorted as candle touched.but see the rally in it for past two days.It made deep hole in my pocket  .
.
Now today by the day end suppose buy signal gets confirmed and candle dont touch 3ema,as it is now,should i wait for next day to exit my shorts or exit at what ever price at 3:25(if 3ema is above 15ema)?
.Now today by the day end suppose buy signal gets confirmed and candle dont touch 3ema,as it is now,should i wait for next day to exit my shorts or exit at what ever price at 3:25(if 3ema is above 15ema)?
 ?
?SH 315 Back Testing Results
I have back tested SH315 system for those who want to see the accuracy and profit % of the signals given by this system. I don't know if this has been done earlier. But anyway I think it will benefit those who have doubts, queries about the system. To earn from a system, one needs to understand it in and out. This is just a small step towards it. I have earlier back tested Anant's (asnavale) system and the results were very well received by the thread participants. I hope participants of this thread also understand the importance of back testing.
Buy and Hold Vs System Results
The first thing any trader should look in the system is to compare it with the Buy and hold strategy. If your system does not do better than the buy and hold strategy, then I don't think that the system is of any use. The main essence of developing a technical system is to outperform the market. These are the results for SH315 system.
Initial Equity: 10,000
Symbol Used: Only Nifty Spot
Direction: Only long trades considered
Commissions: 0.05% per trade
Stop Loss: 8%
Buy and hold profit: 56,155
SH's 315 system's profit: 106,220
We can see that the system has outperformed the buy and hold strategy by quite some margin. Buy and hold strategy gives a return of 500+% whereas SH315's strategy gives the return of 962%. Look at the graph below. The system has continuously outperformed the index from the Year 2000. This essentially reflects the strength of the system.

System Statistics
Avg. Profit/Loss: 782.68
Avg. Profit/Loss%: 2.29
Avg. Bars Held: 16.78
Avg. Profit: % 7.48 %
Avg. Loss :% -2.48 %
Max. Consecutive Wins: 6
Max. Consecutive Losses: 6
Max. system % drawdown: 33.33 %
Payoff Ratio: 2.54
Sharpe Ratio of trades: 0.94
Total Trades: 123
Winning Trades: 58 (47.34%)
Adjusted Annual Return 19.52%
Now, every system has its advantages and disadvantages. Same applies to this system. However, the number of positives in this system are much more in number than the negatives. This is something we saw in asnavale's system too. Firstly, let us discuss the positives. This system has good Avg. Profit/Loss ratio. Most of the systems struggle to get this at a good level. Secondly, the adjusted Annual return of this system is 20%. This is another good thing about this system. Thirdly, the Winning percentage in this system is about 48%. Now this is very impressive. Most of the trend following system's have a winning performance of 35-50%. This indicates that the winning percentage performance in this system is towards the higher range.
Now let us see some negative aspects. The sharpe ratio of trades is 0.94. Ideally Sharpe ratio should be above 1.0. The more higher it is, the better the investor is rewarded in terms of investment made (in risk terms). The Sharpe ratio is used to characterize how well the return of an asset compensates the investor for the risk taken, the higher the Sharpe ratio number the better. However, I would still be fine with this as the system is outperforming the market. The maximum drawdown of the system is 33%. This is towards the higher side and when market's begin to correct, this can effect the capital of investor severely. Also the payoff ratio should be high. Though it's not bad at present, I feel there is scope for improvement.
Overall, I think this system is good. It is a trend following system which is based on very basic rules. Such system's are usually robust and those who stick with them for a long time, surely benefit from it. Entry and Exit rules can be tweaked to get better results. But I leave that for SH to decide upon.
The results mentioned here depend on many factors. By changing the factors, the results yielded can change. I have just used the setting which I feel are comfortable for me.
I have back tested SH315 system for those who want to see the accuracy and profit % of the signals given by this system. I don't know if this has been done earlier. But anyway I think it will benefit those who have doubts, queries about the system. To earn from a system, one needs to understand it in and out. This is just a small step towards it. I have earlier back tested Anant's (asnavale) system and the results were very well received by the thread participants. I hope participants of this thread also understand the importance of back testing.
Buy and Hold Vs System Results
The first thing any trader should look in the system is to compare it with the Buy and hold strategy. If your system does not do better than the buy and hold strategy, then I don't think that the system is of any use. The main essence of developing a technical system is to outperform the market. These are the results for SH315 system.
Initial Equity: 10,000
Symbol Used: Only Nifty Spot
Direction: Only long trades considered
Commissions: 0.05% per trade
Stop Loss: 8%
Buy and hold profit: 56,155
SH's 315 system's profit: 106,220
We can see that the system has outperformed the buy and hold strategy by quite some margin. Buy and hold strategy gives a return of 500+% whereas SH315's strategy gives the return of 962%. Look at the graph below. The system has continuously outperformed the index from the Year 2000. This essentially reflects the strength of the system.
System Statistics
Avg. Profit/Loss: 782.68
Avg. Profit/Loss%: 2.29
Avg. Bars Held: 16.78
Avg. Profit: % 7.48 %
Avg. Loss :% -2.48 %
Max. Consecutive Wins: 6
Max. Consecutive Losses: 6
Max. system % drawdown: 33.33 %
Payoff Ratio: 2.54
Sharpe Ratio of trades: 0.94
Total Trades: 123
Winning Trades: 58 (47.34%)
Adjusted Annual Return 19.52%
Now, every system has its advantages and disadvantages. Same applies to this system. However, the number of positives in this system are much more in number than the negatives. This is something we saw in asnavale's system too. Firstly, let us discuss the positives. This system has good Avg. Profit/Loss ratio. Most of the systems struggle to get this at a good level. Secondly, the adjusted Annual return of this system is 20%. This is another good thing about this system. Thirdly, the Winning percentage in this system is about 48%. Now this is very impressive. Most of the trend following system's have a winning performance of 35-50%. This indicates that the winning percentage performance in this system is towards the higher range.
Now let us see some negative aspects. The sharpe ratio of trades is 0.94. Ideally Sharpe ratio should be above 1.0. The more higher it is, the better the investor is rewarded in terms of investment made (in risk terms). The Sharpe ratio is used to characterize how well the return of an asset compensates the investor for the risk taken, the higher the Sharpe ratio number the better. However, I would still be fine with this as the system is outperforming the market. The maximum drawdown of the system is 33%. This is towards the higher side and when market's begin to correct, this can effect the capital of investor severely. Also the payoff ratio should be high. Though it's not bad at present, I feel there is scope for improvement.
Overall, I think this system is good. It is a trend following system which is based on very basic rules. Such system's are usually robust and those who stick with them for a long time, surely benefit from it. Entry and Exit rules can be tweaked to get better results. But I leave that for SH to decide upon.
The results mentioned here depend on many factors. By changing the factors, the results yielded can change. I have just used the setting which I feel are comfortable for me.
Last edited:
Dear Raunak - Thanks for your backtest results and analysis. I am guessing you have used simple crossover, if would have been good to see the results with
1. 3 EMA bar exit and rentry
2. ADD at 15 EMA touch
Above adds more meat (aka profits) to the overall results.
Also, would have been interesting to see how 'short only' trades have performed.
In the end, many thanks for your efforts on analysing 315 and presenting balanced views, sincerely appreciate it.
Cheers
SH
Hi SH,
Cud u pls reply to above post.
Thank you.
-Raj
Cud u pls reply to above post.
Thank you.
-Raj
Raj - in 315 we exit if 3 EMA is not touching the candle and re-enter when it touches.
In 534, we still exit at 3 EMA not touching and re-enter. We do not use 5 EMA just becuase we are using 534. Rest crossovers are to be used between 5 EMA and 34 EMA.
Cheers
SH
Dear Raunak - Thanks for your backtest results and analysis. I am guessing you have used simple crossover, if would have been good to see the results with
1. 3 EMA bar exit and rentry
2. ADD at 15 EMA touch
Above adds more meat (aka profits) to the overall results.
Also, would have been interesting to see how 'short only' trades have performed.
In the end, many thanks for your efforts on analysing 315 and presenting balanced views, sincerely appreciate it.
Cheers
SH
1. 3 EMA bar exit and rentry
2. ADD at 15 EMA touch
Above adds more meat (aka profits) to the overall results.
Also, would have been interesting to see how 'short only' trades have performed.
In the end, many thanks for your efforts on analysing 315 and presenting balanced views, sincerely appreciate it.
Cheers
SH
Sell: 3EMA crosses 15EMA from above
Short trades were analysed and they had a winning percentage of 33% with drawdown of 40%.
Adding at 15 EMA touch would have increased the profits.
Tc
I shorted dlf around 304 booked next day as candle not touching 3ema.Then again shorted as candle touched.but see the rally in it for past two days.It made deep hole in my pocket .
Now today by the day end suppose buy signal gets confirmed and candle dont touch 3ema,as it is now,should i wait for next day to exit my shorts or exit at what ever price at 3:25(if 3ema is above 15ema)?
.Now today by the day end suppose buy signal gets confirmed and candle dont touch 3ema,as it is now,should i wait for next day to exit my shorts or exit at what ever price at 3:25(if 3ema is above 15ema)?
Dear Arti - you should not be trading futures if a small move against your position is burning a 'deep' hole in your pocket.
Stick to mini nifty for some time, grow you capital for an year before you start trading stock futures.
Cheers
SH
Similar threads
-
Help Needed : Modified SH's 315 Strategy with Supertrend
- Started by Profittaker
- Replies: 2
-
-
-
SH's 315 Strategy - how to make it more comfortable and profitable!!
- Started by rkkarnani
- Replies: 260
-
