PRICE ACTION : No indicators, patterns and theories. Just price.

#51
Dear Sujan,
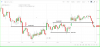
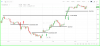
Hope you have keenly observed Infy today. I feel by now your belief in price action has been cemented further. Infy was firm throughout the day. In the later half even as both NIfty and Banknifty moved lower, Infy hit a fresh intraday high. Have a look at today's action below. I have not drawn a reference line today because you really don't need it going forward. Instead, I have drawn a line indicating a higher base being formed as the prices moved up. This higher base can be used as a trailing stoploss to protect profits.

View attachment 32470
Regards.
dear vinod jee today also i will not present in market for personal work , at morning i close observe 2 chart and post to mark with momentum shift area and base line formation please go through this
 

Attachments

#52
dear vinod jee today also i will not present in market for personal work , at morning i close observe 2 chart and post to mark with momentum shift area and base line formation please go through this
Dear Sujan,
I suggest you revisit the charts again and observe more closely. You should be able to mark out areas much better.
Regards.
 
#53
Today's Price action is a reverse trade compared to the earlier session. Kindly observe how support becomes resistance and how prices behave once important areas are taken out. IndusInd bank results were declared day before and the stock witnessed a lot of movement. Kindly observe how the prices came to test the support area yesterday and how the bulls protected the support level. Today the exact reverse happened as the Bulls surrendered a tactical level and the Bears pounced upon it. We can see how steeply the prices fell as the Bears gained the upper hand here.
1547207800246.png


1547208692663.png


Regards.
 
#54
Price action in a failed breakout attempt. The Price action in LT futures for the session 10-01-2019 shows a breakout attempt at 1400 plus levels. However the Bears managed to keep the prices down for the whole session even as there were two more attempts at taking out 1400. The following day 11-01-2019 i.e. today the Bears seized the initiative right from the opening and sustained pressure on the lower side throughout the day.
1547219440790.png


Follow up action in LT futures today .

1547219526841.png


Regards.
 
Last edited:
#55
Hello friends. As mentioned at the start of this thread I had mentioned that I am familiar with TA but was never too inclined to trade based on signals generated by TA. I follow Price action and I am happy with it. Today morning Infosys EOD chart displayed a very compelling Head and Shoulders pattern and hence decided to share it. Kindly share your views as well as a proper stop-loss and target for the same if the pattern is correct. Also share your views regarding failures when such a pattern reverses. Kindly scroll below for the chart. This post is an exception to the thread I have started. Kindly consider it as purely academical.


1552041569372.png


Regards.
 
Last edited:
#56
hmmmm
bro, just be cautious,
if INFY does not revert in next 1-2 sessions
 
#57
Dear traderniftybull the idea here is to identify a pattern and see how it progresses over the next few sessions. As a price action trader I am yet to create a position in this counter but I plan to as soon as my parameters are fulfilled. What I am looking forward to is a one off case study based solely on the premise of TA. This assumes more significance in view of the upgrades assigned to the IT sector yesterday by rating agencies, where they have revised their upward target prices for INFY and TCS significantly. So will the market pay heed to the target upgrades or the prices shall correct steeply towards 690 levels ? At the moment anybody's guess is as good as mine but I feel such opportunities need to be examined and debated upon for our own evolution as better traders.

Regards.
 
#58
My friend
What I have posted on INFY is also based on price patterns/price movement only.
Perhaps, the difference is (may be) that you looked for bearish patterns and I might have looked for bullish patterns :)
 
#60
Excellent ! Now we have different views. TA discounts all news and developments except those on the chart. Price action discounts everything else and looks at just price (of course on the chart). Dear traderniftybull I assume you are of the opinion that based on your study the stock should reverse from the current levels. Whereas our friend timepass shares a contrarian view that the stock prices might correct lower to fill a gap at lower levels. As a price action trader I would wait for a close below 710-12 to initiate a trade. Different views and we all are entitled to them, but we are also aware that the market is more than capable to outsmart us all. The important thing to infer here is that based on data and information exhibited by the chart where should one risk his capital in a calculated manner. Its definitely not about who is right or wrong. Its about conviction and taking a call based on one's experience, training and prudence. The latest EOD chart of INFY is below for all to see.

1552117225195.png


Regards.
 

Similar threads