PRICE ACTION : No indicators, patterns and theories. Just price.

#41
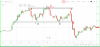
Friends, I have been insisting that Nifty futures need to sustain 10850 levels for the bulls to take charge. So far we have had two unsuccessful attempts and the third attempt was on Friday when the day open and low on nifty futures was 10850. I have attempted to explain the same in the Nifty Futures EOD chart below. I hope it is clear enough to drive home my point. Again I wish to say that this is my own view. Anyone who shares a different view is most welcome to present his idea (limited to TA only). A different view will benefit us all and add another perspective as well. After all the market works because at any give moment there are two different individuals (BUYER AND SELLER) who think differently and trade accordingly.

View attachment 32183
Regards.

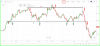
Friends I have been stressing about the importance of 10850 long enough and the market has validated it in the last couple of sessions. Kindly check out the chart below.

1546511305546.png


Regards.
 
#43
Dear Sujan,
Since I have no idea about the way you trade ( day trader, swing trader, positional trader ) I would simply suggest a method which fits in price action. Price action is demand and supply at levels ( created by markets ). With change in sentiment demand and supply keeps changing. In other words support (demand) becomes resistance (supply) and vice versa. If you were to study a chart of any time time frame you will find many areas from where the prices move but all these areas do not qualify as areas where you can initiate a succesful trade. My suggestion is to revisit the charts and observe more minutely. Below is an example of 5 min chart and 15 min chart of Bajfinance futures ( its a way to track movement ) . In hindsight when the trading session is over and you have all the data on chart it seems very easy. However, during live markets, when you are waiting for the next move of the market, it is challenging as you do not have complete data. What you need to understand is that how beyond a particular point marked as R (resistance) the market reacts and how it turns into an S (support). Also notice the amount of time required as the market tests the support and resistance level. Even intra day trading requires patience. Hope you find this useful.

View attachment 32173

View attachment 32174

Regards.
thanks brother for reply with chart explanation , so (4 yrs.) meany years i puzzle with indicator ,i am day trader last 6 month ,i left all indicator and follow only price , with 20 ema , i learn technical by self study , i find my trade only from selected 8 nifty stock . but some times consecutive 2/3 days not find proper trade setup among my selected list that 's why i ask such query
 
#44
thanks brother for reply with chart explanation , so (4 yrs.) meany years i puzzle with indicator ,i am day trader last 6 month ,i left all indicator and follow only price , with 20 ema , i learn technical by self study , i find my trade only from selected 8 nifty stock . but some times consecutive 2/3 days not find proper trade setup among my selected list that 's why i ask such query , may i know your blog address .
 
#45
Dear Sujan,
Not all days are meant for trading. I had no trades on Friday. A good trader also knows when not to trade. No harm is sitting out than burning your fingers. If you are not convinced do not take the trade. It is always good to keep a limited number of scrips in your marketwatch. I always look at Nifty, Banknifty for obvious reasons and the rest I select as per the news flow. If you are following price you do not need anything else, not even volume. Just concentrate on price and you shall start appreciating the change in behavior of a stock at price points which will be your demarcating areas. Kindly have a look at the chart below (Bajfinance futr 15 min chart). I hope it helps. In the chart below see how the price behaves when it is above 2621. As we go ahead see how it behaves as it surrenders 2621. I had taken this trade on Thursday and employed 5 min chart but the demarcating area is identical to the one in this chart also. The same trade was available on Friday morning also but I missed out.

1546769103578.png

Regards,
 
#46
Dear Sujan,
Not all days are meant for trading. I had no trades on Friday. A good trader also knows when not to trade. No harm is sitting out than burning your fingers. If you are not convinced do not take the trade. It is always good to keep a limited number of scrips in your marketwatch. I always look at Nifty, Banknifty for obvious reasons and the rest I select as per the news flow. If you are following price you do not need anything else, not even volume. Just concentrate on price and you shall start appreciating the change in behavior of a stock at price points which will be your demarcating areas. Kindly have a look at the chart below (Bajfinance futr 15 min chart). I hope it helps. In the chart below see how the price behaves when it is above 2621. As we go ahead see how it behaves as it surrenders 2621. I had taken this trade on Thursday and employed 5 min chart but the demarcating area is identical to the one in this chart also. The same trade was available on Friday morning also but I missed out.

View attachment 32432
Regards,
DEAR drvinod jee , i post 2 chart of INFY 15 mins & 5 mins try to mark with reference line , can you please check this one
 

Attachments

#47
DEAR drvinod jee , i post 2 chart of INFY 15 mins & 5 mins try to mark with reference line , can you please check this one
Dear Sujan,
663-662 in Infy qualifies as a good demarcating area. The upper area needs a bit of more observation and researching. You are in the right direction. Consider this as an exercise we are performing jointly. If you have any doubts pm me any time. All the best.
 
#48
Dear Sujan,
663-662 in Infy qualifies as a good demarcating area. The upper area needs a bit of more observation and researching. You are in the right direction. Consider this as an exercise we are performing jointly. If you have any doubts pm me any time. All the best.
"You are in the right direction" thanks drvinod jee , only i can feel how much moral buster and motivation for me, your quote , pray to almighty bless you all the time, i send again INFY chart edited with mark of demarcated area
 

Attachments

Last edited:
#49
"You are in the right direction" thanks drvinod jee , only i can feel how much moral buster and motivation for me, your quote , pray to almighty bless you all the time, i send again INFY chart edited with mark of demarcated area
Dear Sujan,
Hope you have keenly observed Infy today. I feel by now your belief in price action has been cemented further. Infy was firm throughout the day. In the later half even as both NIfty and Banknifty moved lower, Infy hit a fresh intraday high. Have a look at today's action below. I have not drawn a reference line today because you really don't need it going forward. Instead, I have drawn a line indicating a higher base being formed as the prices moved up. This higher base can be used as a trailing stoploss to protect profits.

1546865467074.png

Regards.
 
#50
Dear Sujan,
Hope you have keenly observed Infy today. I feel by now your belief in price action has been cemented further. Infy was firm throughout the day. In the later half even as both NIfty and Banknifty moved lower, Infy hit a fresh intraday high. Have a look at today's action below. I have not drawn a reference line today because you really don't need it going forward. Instead, I have drawn a line indicating a higher base being formed as the prices moved up. This higher base can be used as a trailing stoploss to protect profits.

View attachment 32470
Regards.
hi drvinod jee all day long i wait for your reply . now i reply from mobile , unfortunately upto tuesday i busy with my personal work .
 

Similar threads