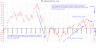
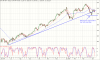
I have attached NSE breadth charts that I have built for my study. Hope these charts help the community here. I have put my analysis on the charts, I usually don't try to predict anything because I believe prediction is not needed to trade successfully. I would rather trade based on what has already happened in the market and then trade based on what the probabilities are. I use these charts to stay on the right side by confirming moves in the market.
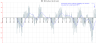
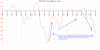
The attached charts are NSE Advance/Decline line, NSE McClellan Oscillator & NSE McClellan Summation Index. You can find tutorials on interpretation of these indicators at
Market Indicators
Brief explanation:
Advance/Decline Line: An early indicator when this line collapses it means that the market has lost leadership and there could be a intermediate move down. This indicator also turns up before the market starts its bull leg. When the market is rising this indicator will confirm by steadily moving up.
McClellan Oscillator: Short to Intermediate overbought-oversold indicator based on advances & declines of the market.
McClellan Summation Index: This indicator is also an early indicator - collapses when the leadership in the market is gone. When this indicator rises strongly it indicates the start of a intermediate term bull move up.
NOTE: These are not timing indicators but give good insight into the internals of the market and can thus aid in eventual timing of investment.
--SwingTrader


 98.1 KB Views: 77