C
Hello there guys
I dont intentionally make them colorful but when you are trading intraday it helps to have as much information reflected in your charts.Screen space is very valuable and I try to squeeze every bit of info i can without cluttering the chart.
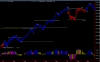
About the charts,the first one has support and resistance lines drawn in.Red and blue lines indicate short term sup. and res. while the thicker lines indiacte much more stronger sup. and res.
The paintbars(colored OHLC bars) are colored according to the trend.In a uptrend they r blue and red in a downtrend.
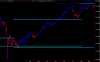
The chart showing targets and all is a system setup and the dots around the ohlc bars are dynamic stoploss levels.The targets have strict stoploss levels.
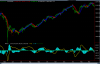
The indicators in chart 2 are smoothed stochastic and ADX.The ADX turns to blue in a uptrend and red in a downtrend.Magenta and yellow indicate weakness or expecting change in trend.
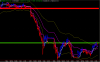
Also added a intraday chart.
CV

I dont intentionally make them colorful but when you are trading intraday it helps to have as much information reflected in your charts.Screen space is very valuable and I try to squeeze every bit of info i can without cluttering the chart.
About the charts,the first one has support and resistance lines drawn in.Red and blue lines indicate short term sup. and res. while the thicker lines indiacte much more stronger sup. and res.
The paintbars(colored OHLC bars) are colored according to the trend.In a uptrend they r blue and red in a downtrend.
The chart showing targets and all is a system setup and the dots around the ohlc bars are dynamic stoploss levels.The targets have strict stoploss levels.
The indicators in chart 2 are smoothed stochastic and ADX.The ADX turns to blue in a uptrend and red in a downtrend.Magenta and yellow indicate weakness or expecting change in trend.
Also added a intraday chart.
CV
Attachments
-
 20.8 KB Views: 90